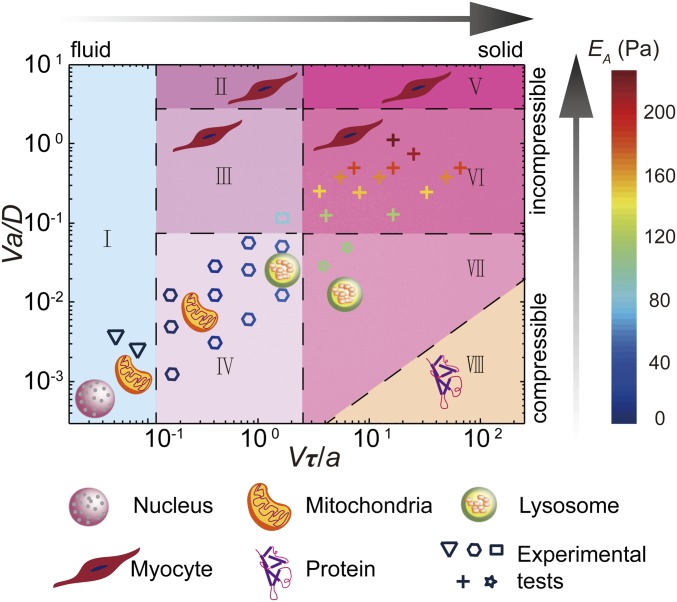
Fig. 5.
The state diagram of living mammalian cytoplasm as a function of two dimensionless numbers, Vτ/a and Va/D. The state diagram shows that as dimensionless number Vτ/a increases from 10−2 to 102 the cytoplasm changes from a viscous fluid to a solid; as dimensionless number Va/D increases from 10−3 to 101 the cytoplasm changes from a compressible material to an incompressible material. Each data point represents an experimental test with that particular speed and size combination. Different symbol shapes of the data points represent different origins of the mechanical resistance, and the color of the symbol represents the value of the measured apparent modulus. Based on our experiments at different loading speeds and probe sizes, combined with our scaling analysis, the origins of mechanical resistance in the cytoplasm can be divided into eight regions of the sate diagram: I, Viscous fluid; the resistance remains a constant as displacement increases (Fig. S4). II, Incompressible viscoelasticity. III, Poroviscoelasticity, where both viscoelasticity and poroelasticity are important (Fig. S7). IV, Compressible viscoelasticity. V, Incompressible pure elasticity; both viscoelasticity and poroelasticity do not relax in this region, and thus the cytoplasmic modulus always remains constant. VI, Poroelasticity. VII, Compressible pure elasticity (Fig. S8); poroelasticity relaxes completely while viscoelasticity does not relax at all in this region. VIII, Continuous mechanics fails when the object is equal or smaller than cytoskeletal mesh size (∼50 nm). Moreover, we mark a variety of physiological intracellular transport and cellular movement phenomena on the state diagram, to illustrate different origins of the mechanical resistance each of these processes experiences. The characteristic size and speed of these phenomena are taken from literature (details in Table S2). The dashed lines in the state diagram are transitional boundaries of different regions; the location of these dashed lines is determined by experimental results and theoretical analysis.

