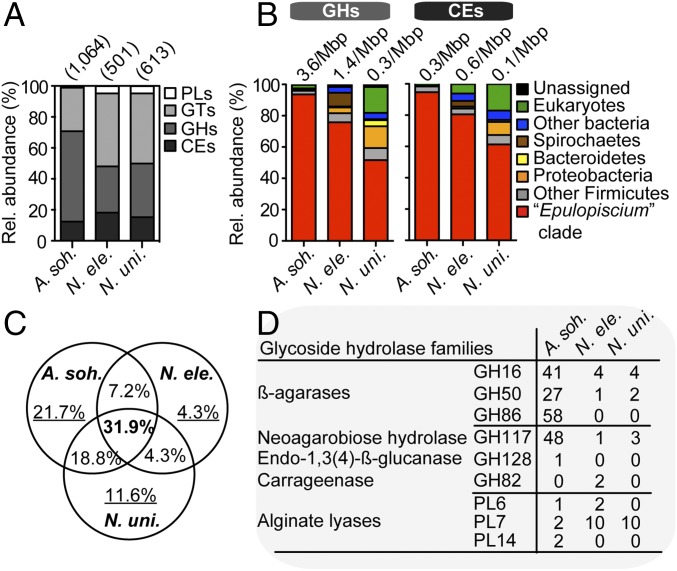
Fig. 2.
Distribution of CAZYmes in gut metagenomes. (A) The relative abundance of CAZyme families in the intestinal metagenomes of three surgeonfishes. Values in parentheses denote the total number of predicted CAZyme-encoding genes. (B) The putative taxonomic origin of GHs and CEs. Values above the bars denote size-scaled abundances in each metagenome. (C) The proportion of nonredundant GH families (from a total of 69) that are shared or unique to each metagenome. (D) Counts of GHs and PLs involved in the digestion of rhodophyte- and phaeophyte-specific polysaccharides in the three metagenomes.

