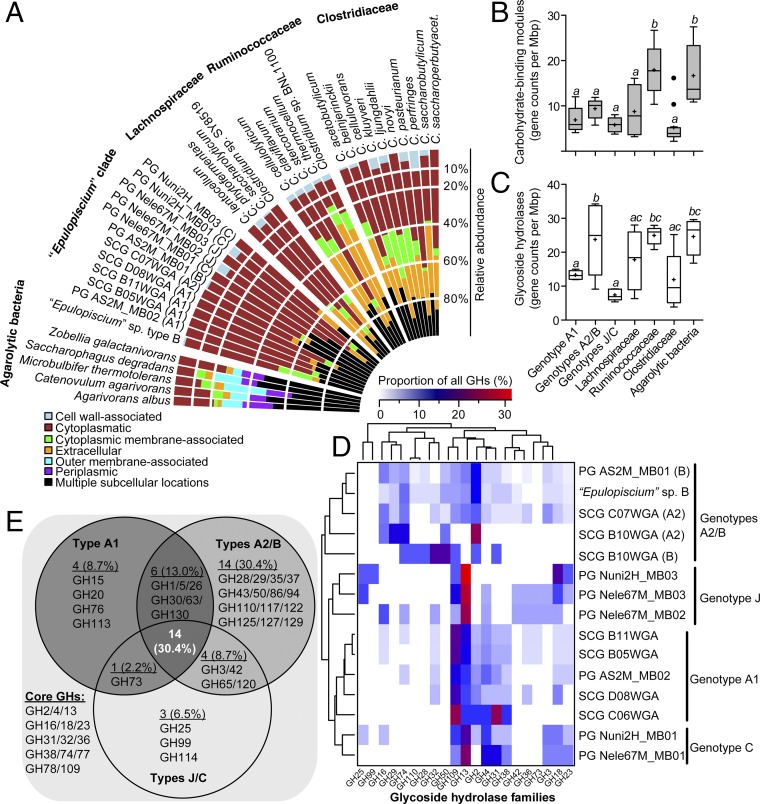
Fig. 4.
Distribution of CAZymes in Ca. Epulopiscium and related giant bacteria. (A) Predicted subcellular localization of GHs in Epulopiscium clade genomes in comparison with free-living agarolytic bacteria and other Clostridia. (B and C) Genome-size normalized counts of CBMs (B) and GHs (C) in different genotypes and in reference genomes. Different letters above the boxplots indicate statistically different groups as measured by one-way ANOVA (P < 0.05). The bottoms and tops of the boxes indicate the first and third interquartiles, respectively. The inside line and plus sign denote the median and mean counts, respectively. The whiskers are located at 1.5× the interquartile range above and below the box. (D) Genome-size scaled relative abundances of 21 most prevalent GHs (>1%) in Epulopiscium genomes. Dendrograms show hierarchical clustering of genotypes (Left) or GH (Top) based on the Bray–Curtis dissimilarity matrix using the average linkage method. (E) Venn diagram showing the inventory of GHs that are conserved, variable, or unique to the pan-genomes of Epulopiscium genotypes.

