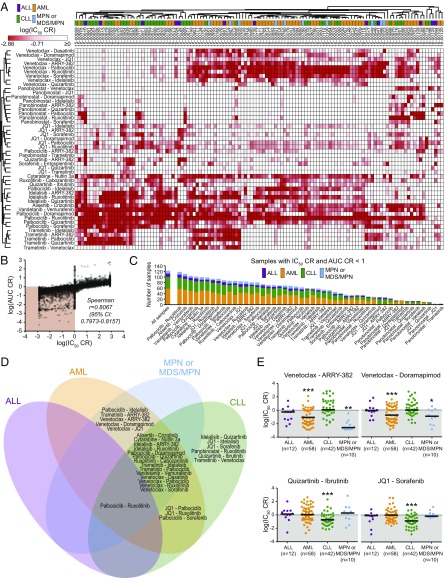
Fig. 1.
Differential patterns of selective efficacy of small-molecule combinations relative to single agents. (A) Unsupervised hierarchical clustering of IC50 CR values for 122 patients with leukemia across 48 tested combinations. IC50 CR values were log-transformed and row- and column-clustered using Pearson correlation pairwise average linkage method. Darker red color (lower CR values) indicates drug combinations exhibiting higher efficacy than either single agent alone. Diagnostic category annotation of each sample is also shown. (B) Correlation of IC50 CR and AUC CR effect measure values. Shaded region indicates sample/drug pairs for which the combination was more effective than either single agent (CR < 1) by both effect measures. (C) Distribution of effective drug combinations based on frequency and diagnostic category. Bar labeled “all samples” indicates diagnosis group breakdown for all 122 surveyed patient samples for comparison. (D) Overlap of significantly effective inhibitor combinations among four general diagnosis subgroups. Combinations for which median IC50 CR and AUC CR were significantly <1 within each diagnostic subgroup are shown; combinations listed in overlapping regions were significantly effective in each subgroup. (E) Select examples of combinations by diagnostic subgroup. Scatter plots of log-transformed IC50 CR values for select combinations. Black horizontal bars represent median CR. (*Median CR significantly <1 in that subgroup.)

