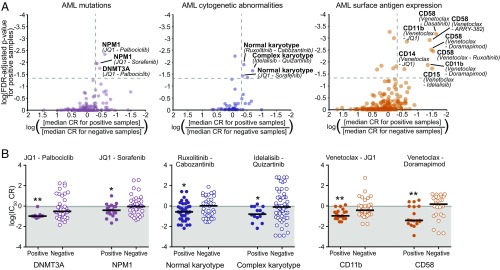
Fig. 3.
Associations of selective inhibitor combination benefit with mutation, cytogenetic, and surface antigen expression features in AML. (A) Scatter plots of combination/feature pairing test significance vs. difference in median CR between subgroups. Summaries for mutation (Left), cytogenetic (Middle), and surface antigens (Right). All plotted points correspond to combination/feature pairings in which (i) median IC50 and AUC CR of the negative samples were not significantly <1 and (ii) positive and negative subgroups contained at least 15% of total evaluable samples each. Points above the horizontal dashed gray line demonstrated median IC50 CR and AUC CR values for positive subgroup that were significantly <1 (i.e., FDR-adjusted P < 0.05). Points to the right of the vertical dashed gray line represent those in which the median IC50 CR value of the positive subgroup was at least twofold lower than that of the negative subgroup. (B) Scatter plots of log-transformed IC50 CR values for select combinations by AML mutation (Left), cytogenetic (Middle), and surface antigen expression subgroups (Right). Black horizontal bars represent median CR value. (*Median CR significantly <1 in that subgroup.)

