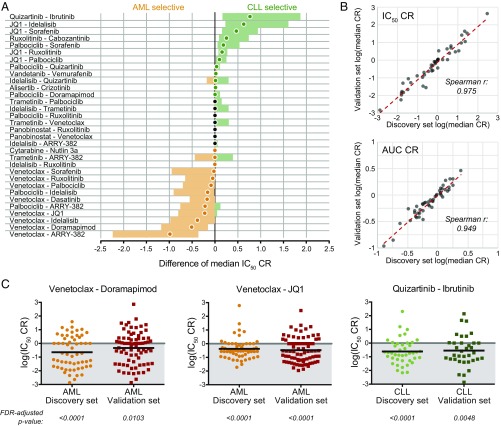
Fig. 6.
Validation of combination selectivity between AML and CLL. (A) The difference of median IC50 CR values (AML – CLL) was computed for each of 48 indicated combinations by using the Hodges-Lehmann method. The median difference is represented by a closed circle, and the 95% CI is shown as the colored bar. AML-selective and CLL-selective combinations are colored orange or green, respectively. (B) Spearman correlation of log-transformed median IC50 CR and AUC CR values between the discovery sample cohort (N = 122) and independent validation cohort (N = 151). (C) Validation of select effective combinations within AML or CLL diagnostic subgroups. Scatter plots of log-transformed IC50 CR values for the indicated combinations. Black horizontal bars represent median CR; FDR-adjusted P values (Wilcoxon signed-rank test of median) are shown.

