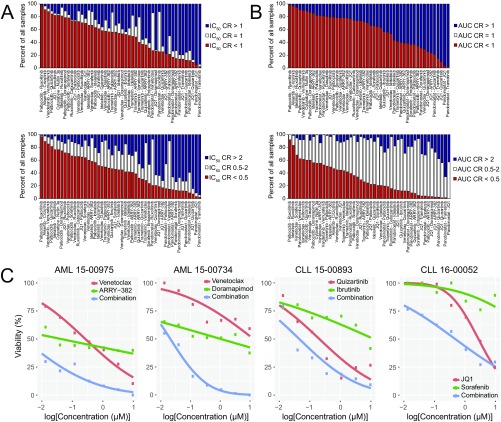
Fig. S3.
Distribution of IC50 and AUC CRs across all tested patient samples. For each combination tested, frequency of samples with CR values are shown for IC50 (A) and AUC (B) effect measures. Two different sets of cut points were examined: CR > 1/CR = 1/CR < 1 (Upper) or CR > 2/CR = 0.5–2/CR < 0.5 (Lower). Combinations are sorted according to frequency of samples with CR values <1 or <0.5, respectively. (C) Representative dose–response curves for patients with AML or CLL exhibiting CR values <1 for select combinations shown in Fig. 1E. Probit-derived curves for each single agent and the combination are shown.

