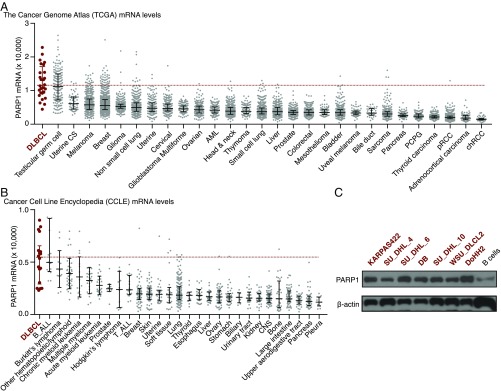
Fig. 1.
DLBCL highly expresses PARP1. (A) PARP1 mRNA levels in human cancers. The data were collected from TCGA. One sample in the DLBCL group is outside of the upper limit of the y-axis, with a value of 35,575. (B) PARP1 mRNA levels in human cancer cell lines. The data were derived from the Cancer Cell Line Encyclopedia from the Broad Institute. In A and B, the middle bars represent the median value, and error bars represent IQR. (C) PARP1 protein expression levels in human B-cell lymphoma cell lines and primary human B cells.

