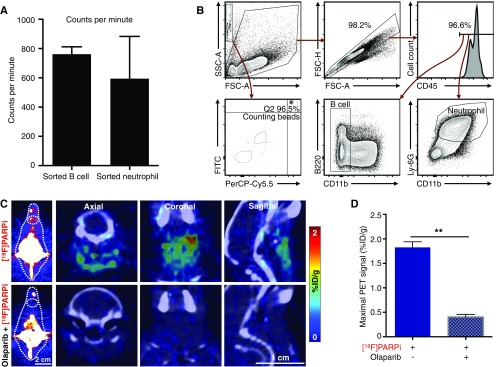
Fig. S3.
PET/CT imaging of B6 mice and key parameters of single-cell radioactivity measurements in DLBCL mouse blood. (A) Average cpm of purified B cells or neutrophils; the background cpm was <30. (B) Flow cytometry procedure for enumerating purified B cells and neutrophils with counting beads and identifying B lymphoma cells and neutrophils. (C) Representative PET/CT images of the lymph nodes of B6 mice injected with [18F]PARPi (n = 4) and preblocked with olaparib (n = 3). (D) Quantification of PET signals in these lymph nodes. Error bars represent SEM. **P < 0.01, two-tailed Student’s t test with assumption of unequal SD.

