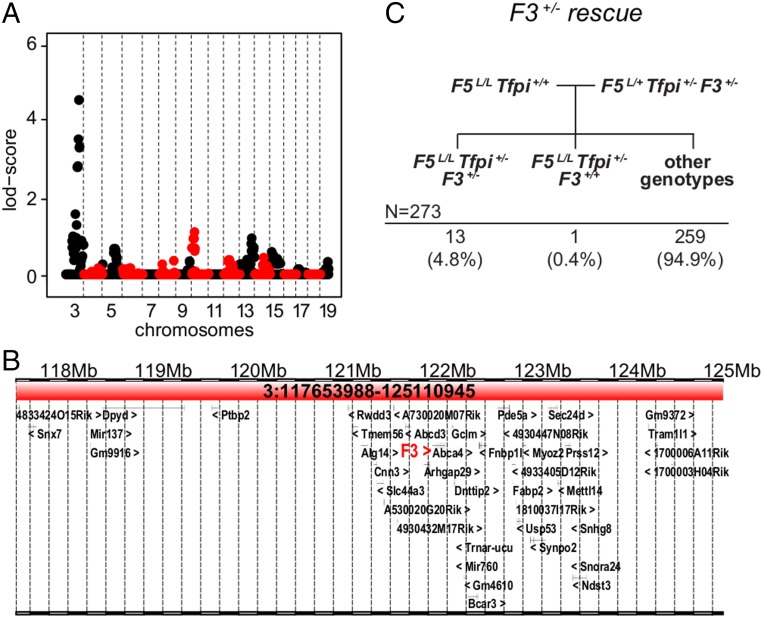
Fig. 2.
The MF5L6 suppressor locus maps to Chr3. (A) Linkage analysis for the MF5L6 line. Alternating red and black are used to highlight the chromosomes. Chrs 1 and 2 were excluded from further analysis since they contain the F5 and Tfpi genes, whose segregation was restricted by required genotypes at these loci. The Chr3 peak had the highest LOD score in the Chr3 subregion: 117.3–124.8 Mb [maximum LOD = 4.49, one LOD interval, significance threshold of LOD >3.3 (44)]. (B) The Chr3 candidate interval (Chr3:117.3–124.8 Mb) contains 43 RefSeq-annotated genes, including F3. (C) The mating scheme and observed distribution of offspring to test F3 deficiency as a suppressor of F5L/L Tfpi+/−. F3+/− results in incompletely penetrant suppression of the F5L/L Tfpi+/− phenotype.

