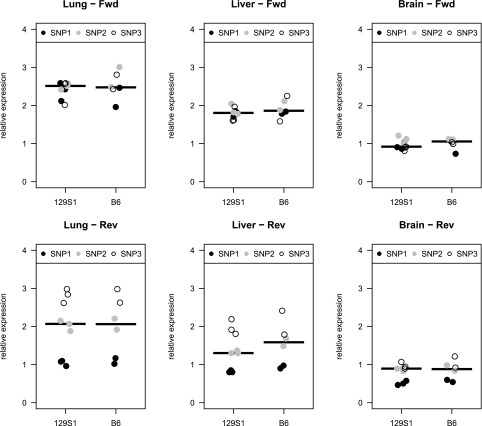
Fig. S1.
Relative expression analysis of F3 alleles. Expression differences between 129S1 and B6 alleles were estimated at three different SNPs: (i) rs30268372, (ii) rs30269285, and (iii) 30269288 using both forward (Fwd) and reverse (Rev) sequences of cDNA extracted from lung, liver, and whole-brain tissues of adult mice. No significant differences were observed between the alleles in any of the tested tissues. Relative expression (y axis) represents the expression levels of B6 and 129S1 alleles normalized to the level of the DBA allele (Methods).

