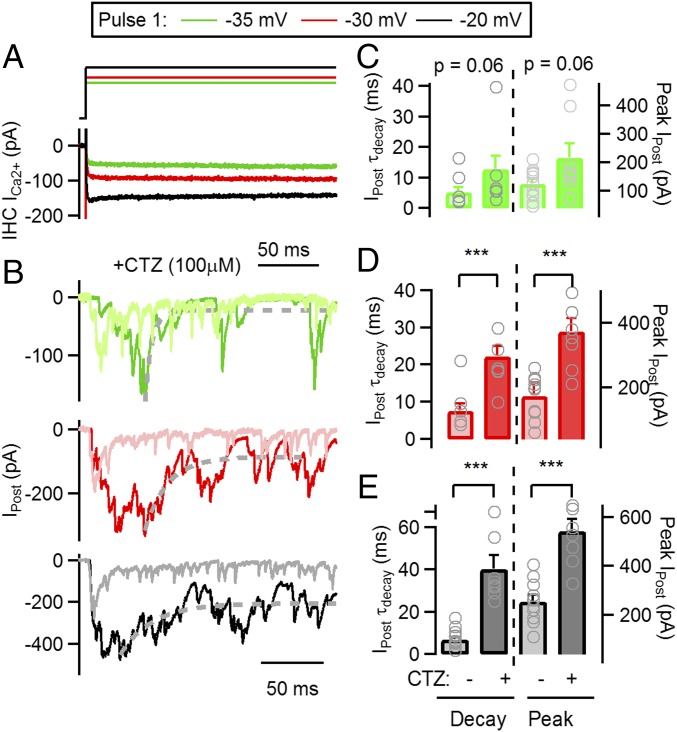
Fig. 4.
Application of CTZ during synaptic transmission produces a slowing of decay kinetics. (A) Voltage protocol applied on IHC (Top) consisting of a sustained depolarization at −35 (green), −30 (red), and −20 mV (black). Bottom traces show IHC Ca2+ currents. (B) Average postsynaptic responses to the voltage protocol applied on the IHC and shown in A, following the same color code. Control recordings (obtained in the absence of CTZ) are also included (−35 mV responses in pale green, −30 mv in pale red, and −20 mV in gray). Dashed gray line represents exponential fitting function. (C) Average τdecay (left axis) for responses at −35 mV in control and CTZ (Left), and average peak amplitude (right axis) in the same experimental conditions. Gray symbols represent values for individual cell pairs. (D) Same as in C, but for −30 mV responses. (E) Same as in C, but for −20 mV responses. ***P < 0.001.

