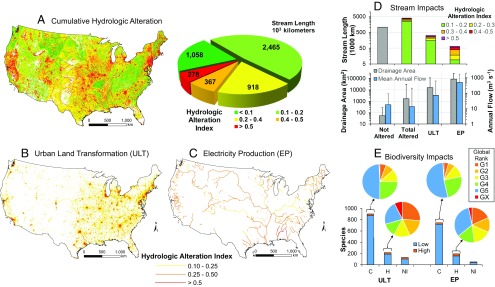
Fig. 2.
Hydrologic and biodiversity impacts of ULT and EP in the contiguous United States. (A) Cumulative hydrologic alteration mapped to stream reaches and distribution of stream length by degree of alteration. (B) ULT and (C) EP impacts on hydrologic alteration in the nation’s streams. (D) Stream distance and size characteristics impacted by ULT and EP sectors. (E) Biodiversity impacts (fish, crayfish, and bivalves) of each sector consider current (C), historically present (H) but locally extinct, and nonindigenous (NI) species and global conservation ranking (SI Methods). Low (blue bars) and high (red bars) estimates generated by accounting for detection probability.

