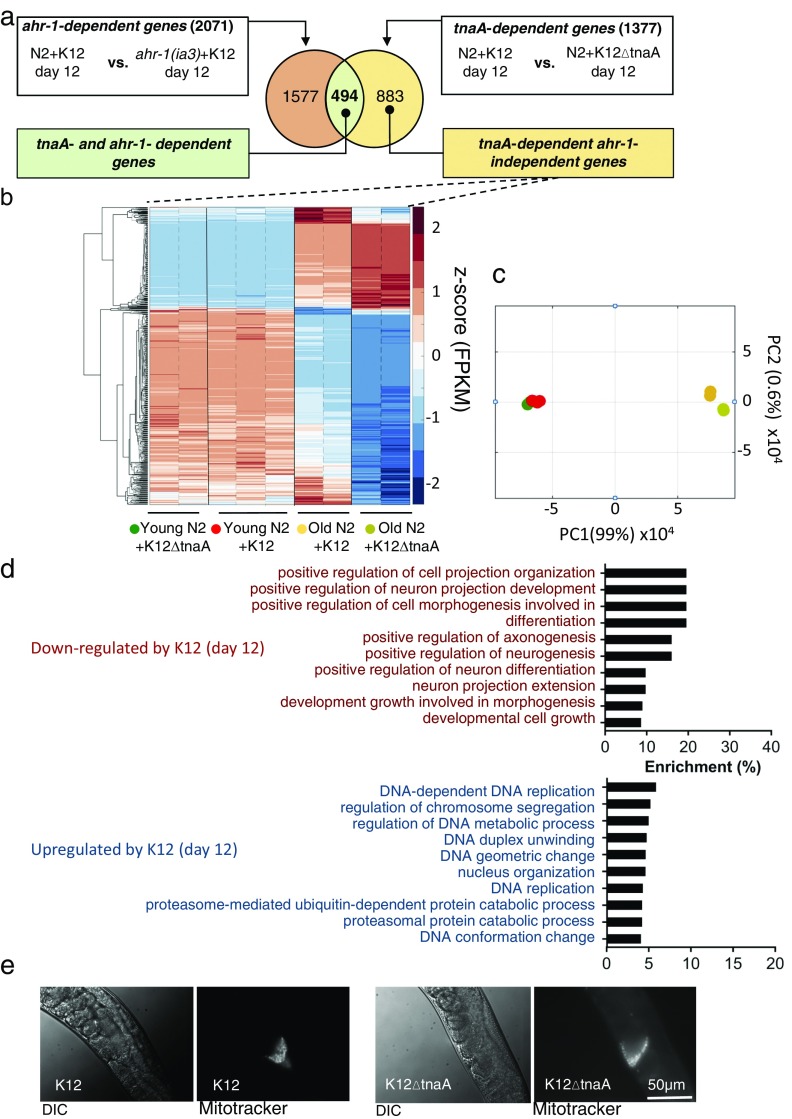
Fig. S4.
Characterization of transcriptional responses from C. elegans. (A) Schematic for the identification TnaA-dependent and Ahr-independent genes. (B) Expression profile of TnaA-dependent and Ahr-independent genes in young and old animals grown in K12 or K12ΔtnaA through hierarchical clustering of genes based on their corresponding z-score values. The replicates in each condition are separated by dotted black line; conditions are demarcated by solid black line. (C) PCA with FPKM values of TnaA-dependent and Ahr-independent genes in young and old animals grown in K12 or K12ΔtnaA. (D) GO output with TnaA-dependent and Ahr-independent genes performed using GOAmigo software. (E) Images of spermatheca of day 12 adult N2 hermaphrodites grown in K12 or K12ΔtnaA, after mating with males whose sperm had been labeled with MitoTracker. (Scale bar, 50 µm.)

