Fig. 2.
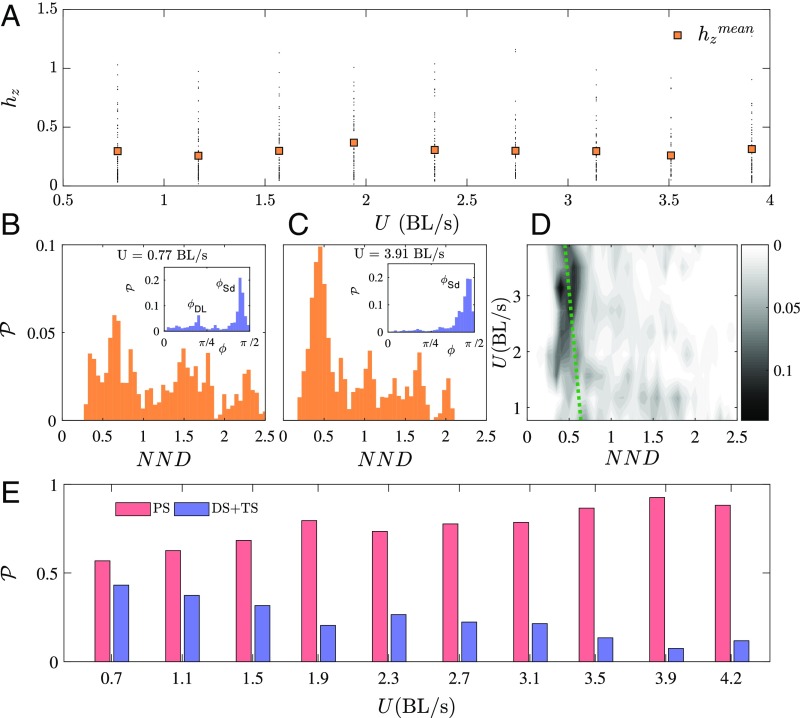
Statistical properties of the fish schools as a function of swimming speeds over the whole range of cases studied (see Tables S1 and S2). (A) Variation of the -position of fish ( is the depth normalized by the fish average body height) as a function of swimming speed. Small black dots represent the instantaneous position of each fish, whereas orange squares represent average position, averaged over all groups. (B and C) Probability density of the NND for low (B) and high (C) swimming speeds. B and C, Insets show the probability density of nearest-neighbor angles . (D) Probability density map of NND as a function of the swimming speed. (E) Percentage of occurrences of diamond-shaped (DS) [or T-shaped (TS)] and phalanx-shaped (PS) patterns. High-speed swimmers are mainly characterized by phalanx patterns and short NND in comparison with low speed regimes.

