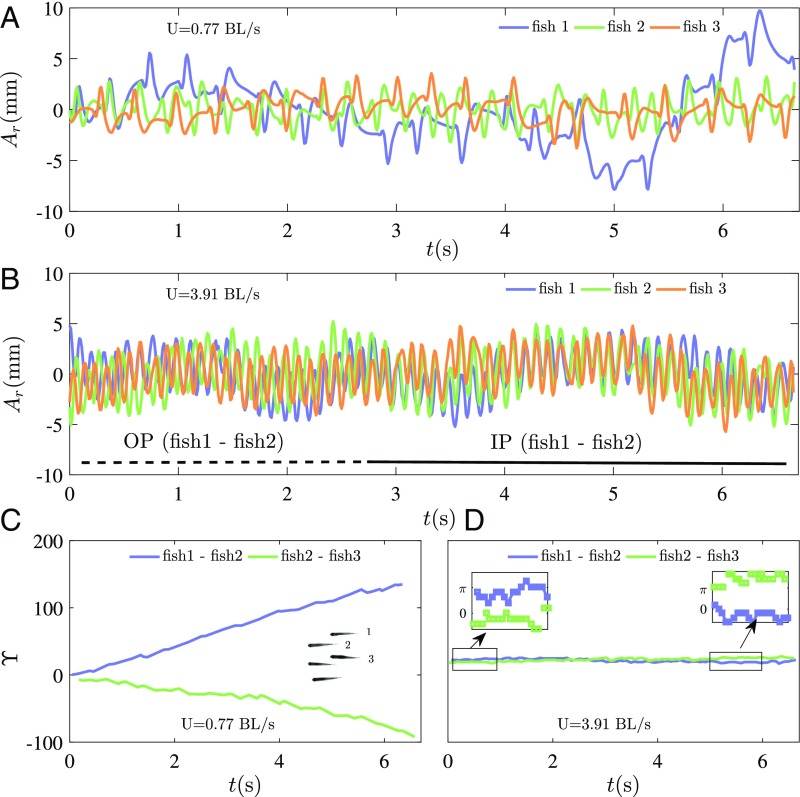
Fig. 4.
Examples of time series of the tail tip amplitude for one given individual (fish 2) within the school and its two nearest neighbors (fish 1 and 3). (A and B) Low (A) and high (B) swimming speed. The in-phase (IP) and out-of-phase (OP) swimming regimes are also shown. (C and D) Evolution of the phase difference between fish 2 and its two nearest neighbors (fish 1 and 3) showing a nonsynchronized state () at low swimming speed (C) and strongly synchronized state () at high swimming speeds (D). D, Insets show zooms in the case of synchronized swimming that are either around (for IP synchronization) or (for OP synchronization).

