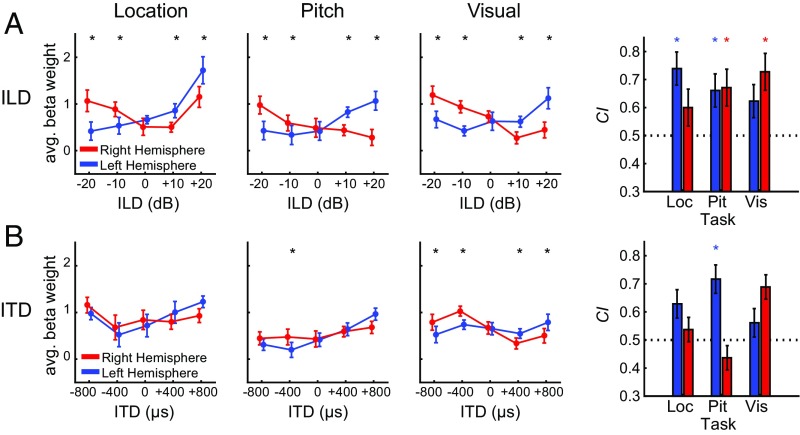
Fig. 2.
Binaural cue response functions characterize cortical sensitivity. Response functions quantify tuning to (A) ILD and (B) ITD during location, pitch, and visual tasks averaged across subjects. Significant interhemispheric statistical comparisons of left and right hemisphere for each spatial cue value are reflected with black asterisks at top of each figure. CI, measured across participants for each hemisphere (right column), quantifies degree of contralateral versus ipsilateral activity. Red and blue asterisks correspond to significant difference from H0 = 0.5 for right and left hemisphere, respectively. Asterisks denote statistical significance following control for FDR (q = 0.05). All error bars correspond to the SEM.

