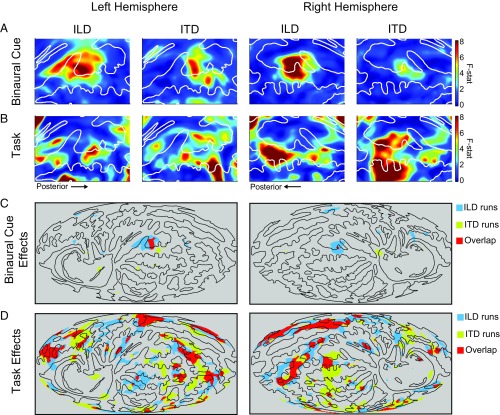
Fig. 4.
Statistical analysis of cortical surface maps. Cortical surface projections represent the main effects of binaural cue and task resulting from a two-factor repeated-measures ANOVA at each surface voxel. (A) Binaural cue: Main effects of binaural cue in left and right hemisphere. (B) Task: Main effect of task in left and right hemisphere. In A and B, colors correspond to F values computed at each surface voxel. White contours correspond to gyral anatomy of the population average. (C and D) Whole-hemisphere view of cortical topography of (C) binaural cue and (D) task effects. Colors indicate statistically significant regions from A and B replotted for ILD runs (blue), ITD runs (yellow), or regions of overlap (red). Black contours correspond to the same gyral anatomy as in A and B.

