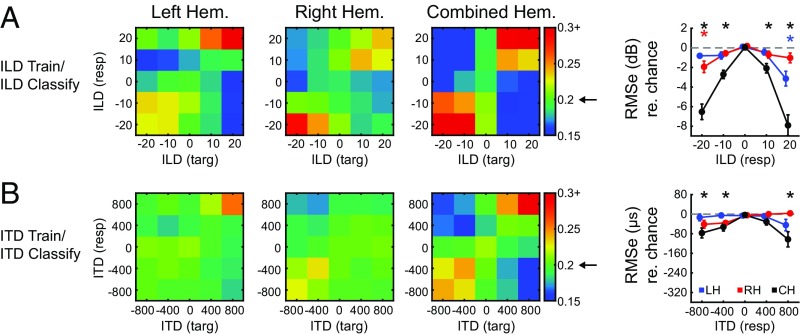
Fig. 5.
Within-cue classification. Confusion matrices present classification probability when a linear classifier is (A) trained and tested using ILD trials and (B) trained and tested using ITD trials for left (LH), right (RH), and combined hemisphere (CH) datasets. Targets and responses are represented on the x and y axis, respectively. Arrow on colorbar indicates chance probability. Column 4 quantifies the rms error (with respect to chance) as a function of binaural cue for each dataset. Chance is indicated by dashed gray line. Asterisks indicate significance based on comparison with permuted dataset (P < 0.05) for left (blue), right (red), and combined (black) hemispheres.

