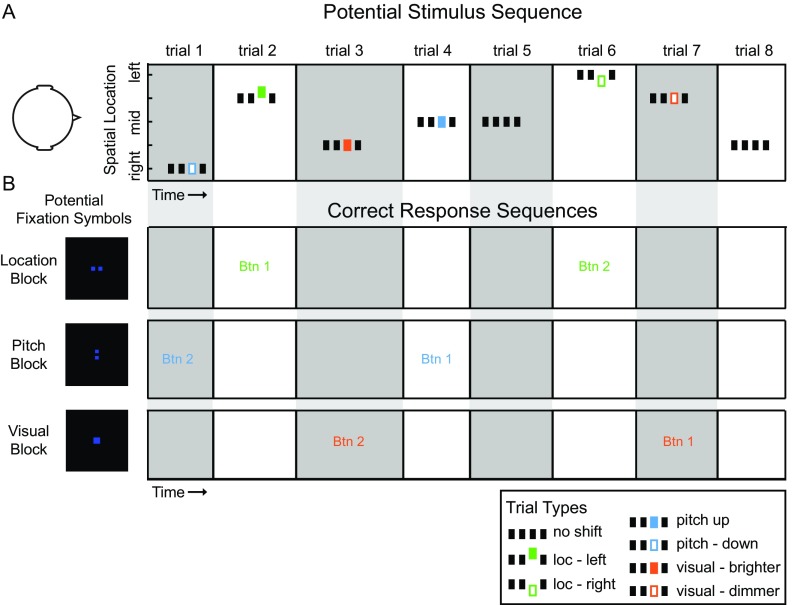
Fig. S1.
Example timeline of stimulus presentation and corresponding task protocols. (A) Schematic timeline of a potential stimulus sequence consisting of eight trials. Within each trial, noise-burst trains were presented in four temporal intervals (grouped rectangles) with ILD or ITD at one of five binaural cue values. ITD and ILD were tested in separate runs. On 78% of trials, the third interval introduced a stimulus change in one of three dimensions: Auditory location (green), auditory pitch (blue), or visual brightness of fixation cue (orange). Trials lasted 1 s overall and were presented with jittered intertrial timing of 1–5 s. (B) Schematic representation of three potential timelines of correct behavioral responses for the sample stimulus sequence in A. Fixation symbol informed participants of the task/target type in each 30-s task block. Two squares arranged horizontally cued a location block, in which target trials were defined by auditory location change in interval 3. Participants responded to target trials by indicating the direction of change. Two squares arranged vertically cued a pitch block in which target trials were defined by pitch change, and a single square cued a visual block in which target trials were defined by change in brightness of the square on the fixation screen. Text (Btn1 or Btn2, button 1 or 2) indicates the correct response for each trial in the sample stimulus sequence (A), given the task block indicated by the fixation symbol at left.

