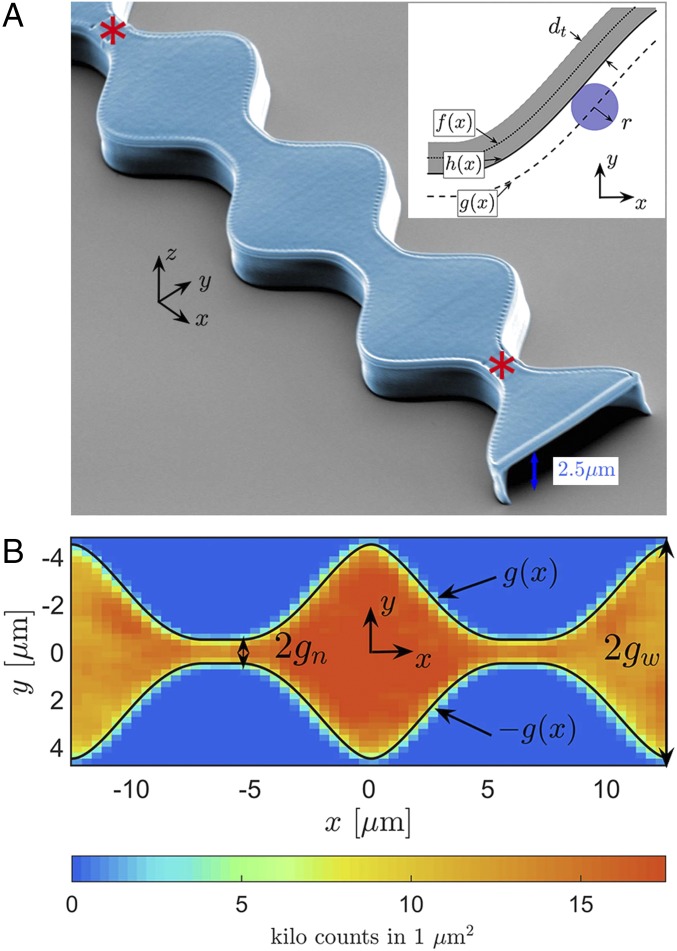
Fig. 1.
(A) Scanning electron image of a channel of inner height m. Narrow openings at the two ends are marked by red asterisks. Inset illustrates the channel’s geometry: the laser-scanning contour, , the wall inner boundary, , and the effective boundary of the space accessible to the particle center, ; m and m are the wall thickness and the particle radius, respectively. (B) Spatial distribution of particle counts in a typical 20-h-long experiment. The effective channel boundary is marked by black lines and is denoted by (Eq. 1); here, m, and m.

