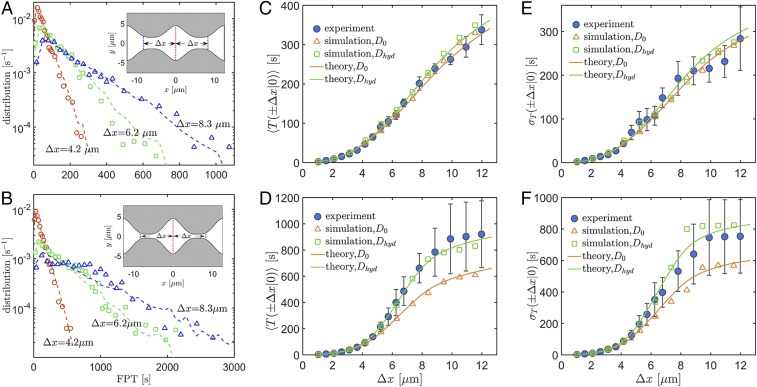
Fig. 2.
(A and B) Probability distributions, (C and D) averages, and (E and F) SDs of the FPTs in (A, C, and E) wide (m) and (B, D, and F) narrow (m) channels with the same maximum half-width, m. In A and B, experimental data (symbols) are compared with the outcome of BD simulations (curves) for the spatially modulated diffusivity, . The relevant channel profiles, , are shown in A, Inset and B, Inset; vertical dashed segments mark the starting (red: ) and ending (blue: ) positions of the first passage events. In C–F, experimental, numerical, and theoretical results are shown as solid symbols, open symbols, and solid curves, respectively. Numerical and theoretical results with constant and varying diffusivity are color-coded orange and green, respectively.

