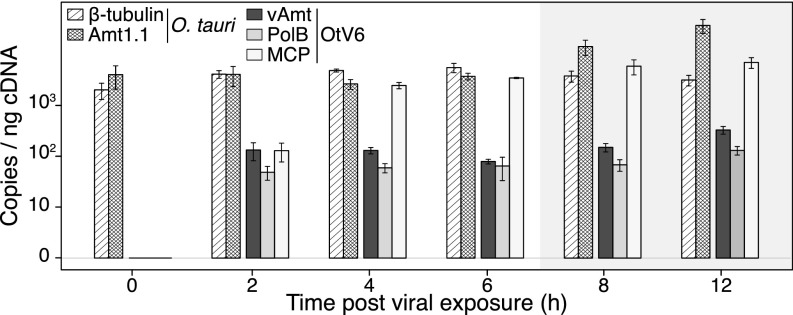
Fig. 5.
OtV6-infected O. tauri gene expression. Transcript levels were RT-qPCR monitored in infected O. tauri cultures (n = 3; same infected cultures as presented in Fig. 4) and expressed as copies per nanogram of cDNA library (displayed on a log10 scale, y axis). Hatched bars show transcript copy numbers of two O. tauri genes (-tubulin and the transporter Amt1.1); solid color bars show copy numbers for three OtV6 genes (dark gray, viral transporter, vAmt; light gray, DNA polymerase B; white, major capsid protein). Error bars represent SEs. Shaded overlays indicate incubator dark period (night).

