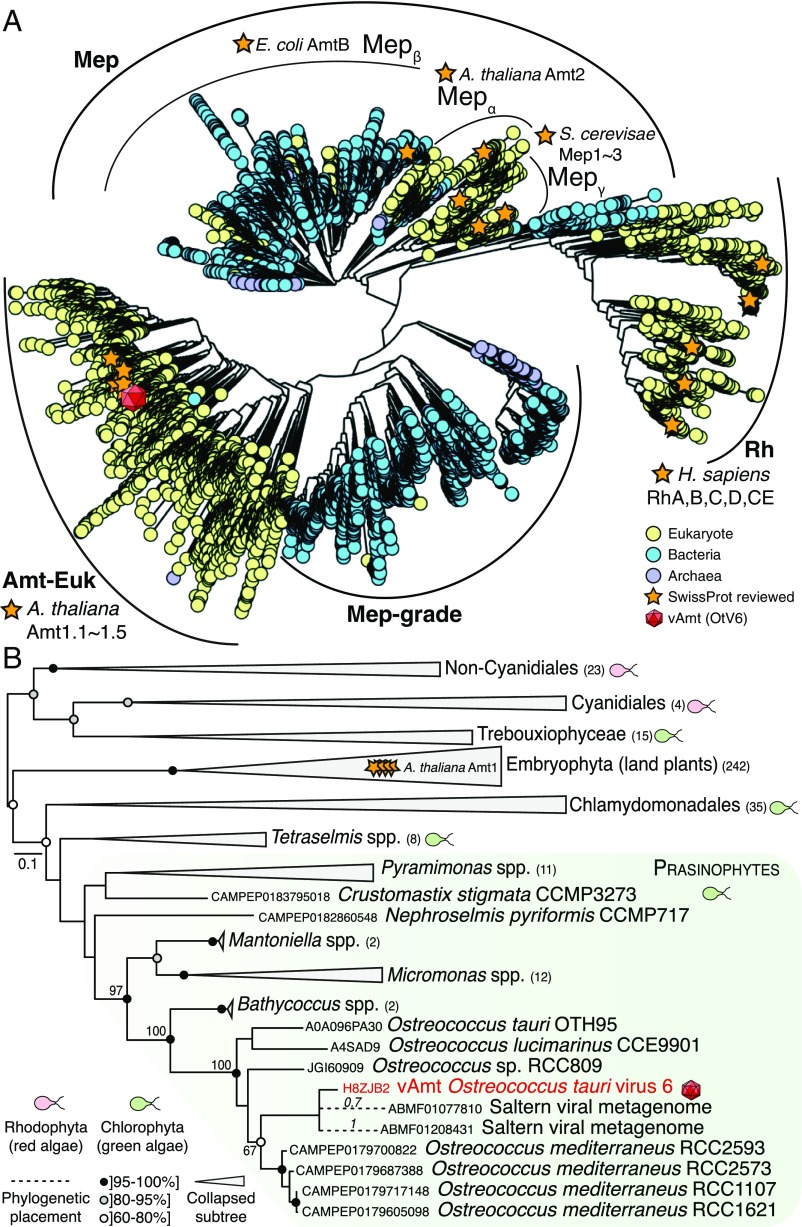
Fig. 6.
vAmt phylogenetic ancestry shows it is derived by HGT from the host lineage. (A) Amt/Mep/Rh superfamily phylogenetic tree. This large-scale approximate ML tree was inferred under the WAG+G model. Putative homologs were recruited based on a similarity search using the Pfam HMM corresponding to the Amt/Mep/Rh superfamily (PF00909) against UniRef100 (i.e., nonredundant version of UniProtKB), MMETSP protist transcriptomes, and predicted proteomes from various protist genome projects; the final curated alignment was composed of ∼20,000 protein sequences encompassing 374 sites. Curved black lines indicate the phylogenetic positions of the main clades (Amt-Euk, Mep, Mep-grade, and Rh) as well as Mep subclades (, , and ). The red capsid graphics show the phylogenetic position of the vAmt within the superfamily tree, positioned within the Amt-Euk clade. For contextual reference, orange stars represent SwissProt reviewed protein entries; yellow, blue, and purple circles represent eukaryotic, bacterial, and archaeal proteins, respectively. See SI Appendix, Fig. S11 for additional information, including local support values, MMETSP sequence positions, and scale bar. (B) vAmt evolutionary relationships with Amt-Euk (Amt1) homologs. This ML phylogenetic tree was inferred under the LG+I+G+F model, based on a multiple alignment of 364 proteins totaling 429 sites. These vAmt homologs were recruited and selected based on the Amt/Rh/Mep superfamily phylogenetic tree reconstruction. Green and red cell schematics represent green and red algal lineages. vAmt is highlighted in red with capsid graphics and branched within the prasinophyte green algae, delimited by a green frame. Code numbers in front of species names represent sequence identifiers from the MMETSP transcriptomes (O. mediterraneus, Nephroselmis pyriformis, and Crustomastix stigmata), UniProtKB (O. lucimarinus and O. tauri), and the Ostreococcus sp. RCC809 genome project available at the DoE-Joint Genome Institute. Numbers in parentheses beside clade names are the number of sequences present in collapsed nodes. Branch node supports were computed from 1,000 nonparametric bootstrap replicates. Gray and black circles correspond to bootstrap values of ]80, 95%] and ]95, 100%], respectively. The dashed branches represent the phylogenetic placement of two short environmental sequences, with placement posterior probabilities indicated on their corresponding branches; both sequences originate from a saltern viral metagenome (NCBI BioProject: PRJNA28353), and their GenBank sequence identifiers are provided. See SI Appendix, Fig. S12 for additional data and uncollapsed branch information.

