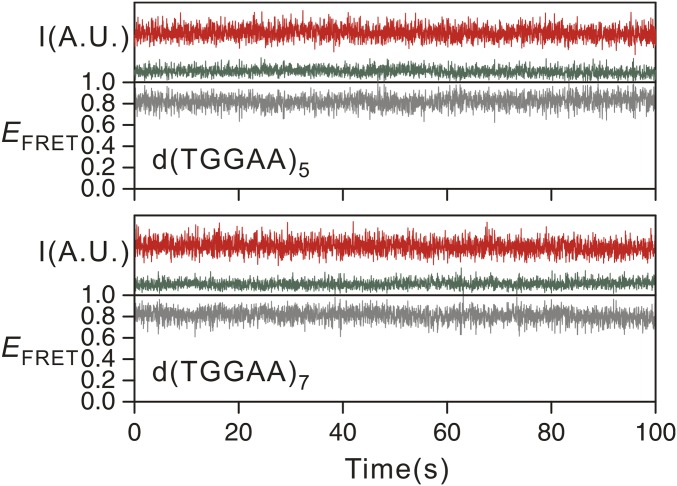
Fig. S4.
Representative EFRET time traces for d(TGGAA)5 and d(TGGAA)7. The green red curves represent the intensities of the Cy3 and Cy5 fluorescence signal, respectively. The gray curves represent the EFRET (unitless). The vast majority of traces, including those not shown here, are virtually stable at one EFRET state. A.U., arbitrary unit; I, intensity.

