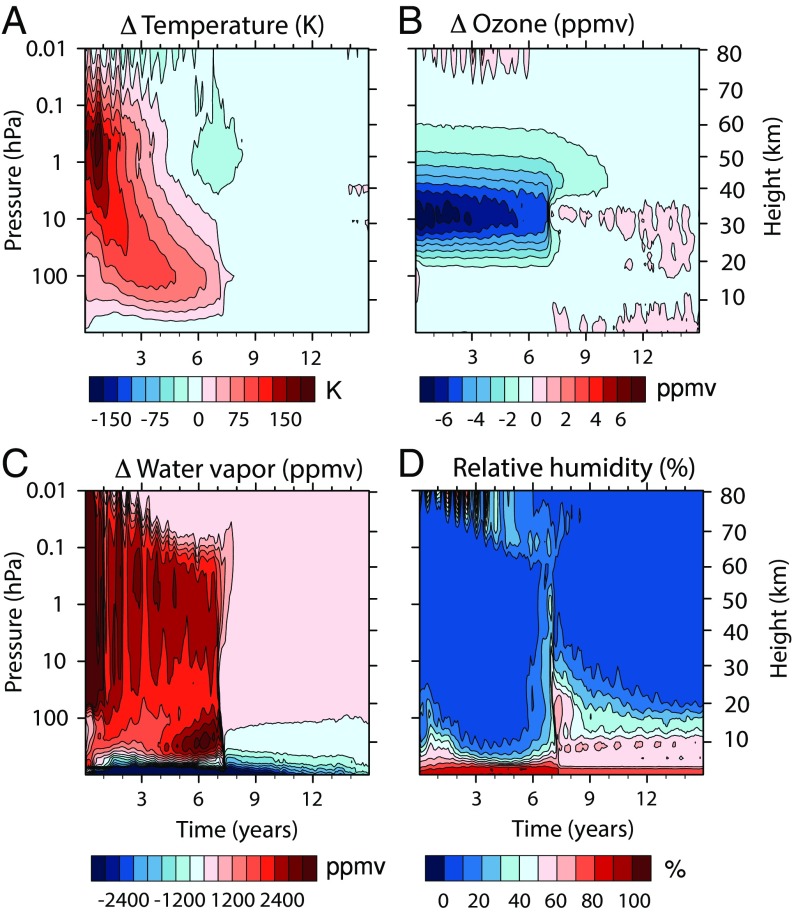
Fig. 9.
Evolution of the change in vertical structure of (A) global average atmospheric temperature, (B) ozone, (C) water vapor, and (D) relative humidity after the impact in the 15,000-Tg simulation. All plots show the difference between the impact and the control simulations, except for relative humidity, which shows the absolute value.

