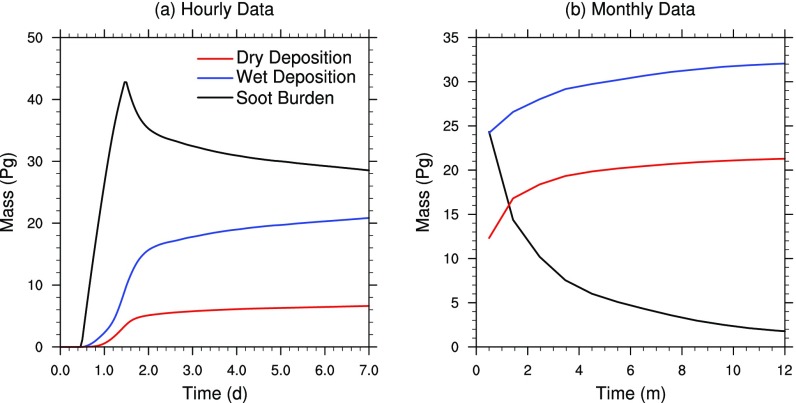
Fig. S1.
Evolution of soot burden (black) and cumulative wet (blue) and dry (red) deposition for the simulation with 15,000 Tg of fine soot and 41,000 Tg of coarse soot, including injections of H2O, CO2, and heat from fires for (A) 1 wk using hourly data and (B) 1 y using monthly average data. The soot is emitted over the first 12 h to 36 h and is followed by rapid wet and dry removal. After 1 y, the remaining soot burden is 4% of the total 56,000-Tg emission, with 57% removed by wet deposition and 38% removed by dry deposition.

