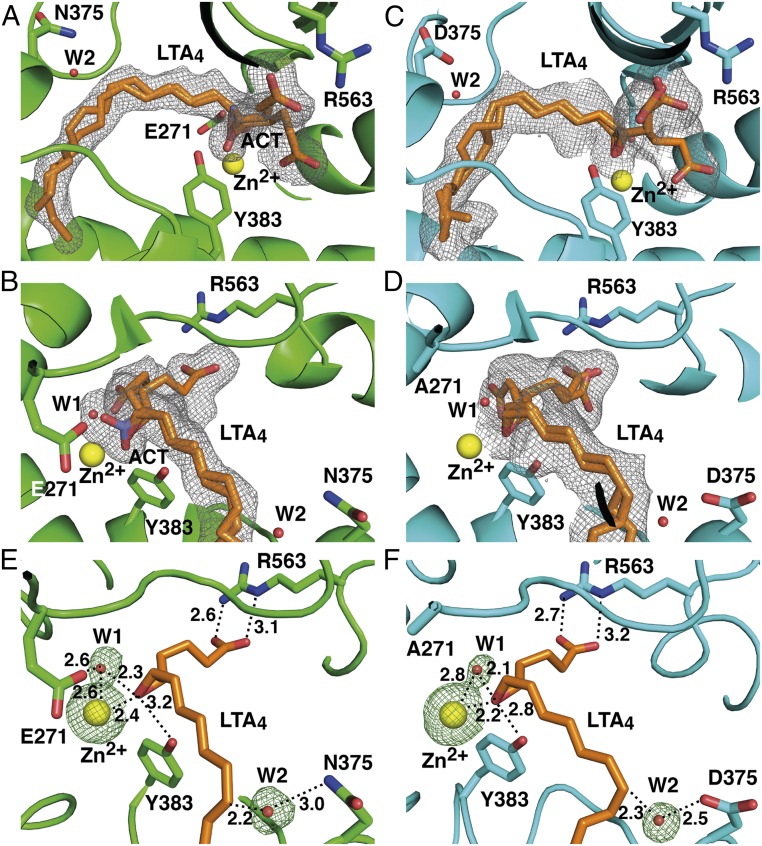
Fig. 1.
Binding of LTA4 in the active site of LTA4H. (A and B) Different views of the active site of orthorhombic D375N (residues are in green) complexed with LTA4 (orange) and acetate (ACT, violet). Yellow and red spheres represent Zn2+ and catalytic waters, respectively. mFo-DFc polder omit map contoured at 3.0 σ is shown in gray mesh around LTA4 and ACT. (C and D) Different views of the active site of orthorhombic E271A-LTA4 complex (residues are in cyan). (E) LTA4 bound with its C1 carboxylate anchored to R563 in the active sites of D375N and (F) E271A. mFo-DFc omit map for Zn2+ and catalytic waters is shown in green mash at 3.0 σ. Distances are labeled in Å.

