Fig. 2.

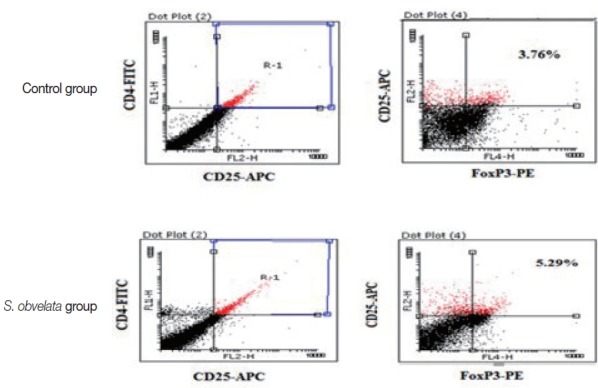
FACS analysis demonstrating the percentage of CD4+CD25+Foxp3+ Tregs population in MLN cells from a representative sample of each group.

FACS analysis demonstrating the percentage of CD4+CD25+Foxp3+ Tregs population in MLN cells from a representative sample of each group.