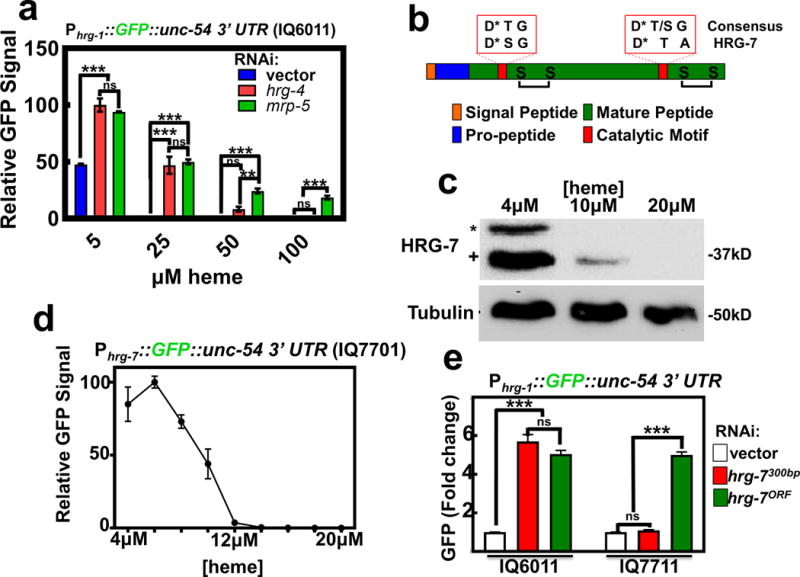
Figure 1. Heme homeostasis is regulated by the aspartic protease homolog hrg-7.

a) GFP fluorescence quantified from strain IQ6011 (Phrg-1::GFP) fed dsRNA against control vector, hrg-4, or mrp-5 at 5, 25, 50, and 100 μM heme. GFP was quantified using COPAS BioSort. GFP is represented as fold change compared to vector. Graph represents the mean and SEM of three biological independent experiments. N=120 worms per treatment per experiment. ***P<0.001, **P<0.01, *P<0.05 (two-way ANOVA). See Supplementary Table 3 for statistics source data. b) Cartoon depicting general features of aspartic proteases. * indicates catalytic Asp residues. c) Immunoblot analysis of HRG-7 expression in N2 grown in increasing heme concentrations. Membranes were probed with polyclonal anti-HRG-7 antibody and then incubated with HRP-conjugated anti-rabbit secondary antibody. * indicates pro-HRG-7. + indicates mature HRG-7. Unprocessed blots are shown in Figure S6. Data representative of three independent experiments. d) GFP expression in strain IQ7701 (Phrg-7::GFP) grown in varying heme concentrations. GFP was quantified with the COPAS BioSort. GFP is represented as relative intensity on a scale of 1-100. Graph represents the mean and SEM of three biological independent experiments. N=100 worms per treatment per experiment. e) GFP fluorescence quantified from IQ6011 (Phrg-1::GFP) and IQ7711 (Pvha-6::HRG-7PR:ICS::mCherry; Phrg-1::GFP) fed dsRNA against control vector, hrg-7300bp, and hrg-7ORF at 10 μM heme. GFP was quantified using COPAS BioSort. GFP is presented as fold change compared to vector. Graph represents the mean and SEM of three biological independent experiments. N=120 worms per treatment per experiment. ***P<0.001, **P<0.01, *P<0.05 (one-way ANOVA). See Supplementary Table 3 for statistics source data.
