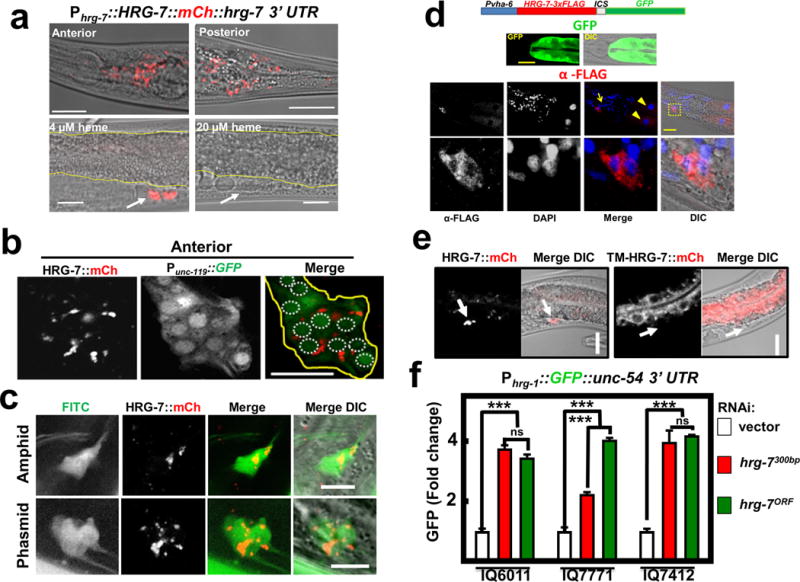
Figure 2. HRG-7 is secreted and functions in a cell-nonautonomous manner.

a) mCherry expression in IQ7777 (Phrg-7::HRG-7::mCherry). Intestine is indicated by yellow lines, coelomocytes are indicated by a white arrow. Scale bar = 20 μm. Images are representative of three independent experiments. b) Coexpression of the pan-neuronal GFP marker Punc-119::GFP and Pvha-6::HRG-7::mCherry. Image is representative of the anterior of adults. Yellow outline indicates nerve ring. White dotted circles indicate nerve ring nuclei. Scale bar = 10 μM. Images are representative of three independent experiments. c) IQ7670 (Pvha-6::HRG-7::mCherry) were pulsed with 10 μg /ml FITC for 3 hours, then analyzed by confocal microscopy. Scale bar = 5 μM. Images are representative of three independent experiments. d) Fluorescence and immunofluorescence images of worms expressing Pvha-6::HRG-7-3XFLAG::ICS::mCherry. GFP expression was analyzed in live worms. HRG-7-3XFLAG expression was analyzed in fixed worms incubated with M2 α-FLAG antibody followed by incubation with Tetramethyl Rhodamine 5 (and 6)-Isothiocyanate (TRITC) conjugated goat-α-mouse antibody and DAPI. Arrow indicates neuron nuclei. Arrowhead indicates intestine nuclei. Bottom panels are zoomed-in images of boxed region indicated in the middle panels. Images are representative of two independent experiments. Scale bar = 20μm. e) mCherry fluorescence in worms expressing Pvha-6::HRG-7PR::mCherry or Pvha-6::TM-HRG-7PR::mCherry. Arrows indicate middle coelomocytes near the vulva. Scale bar = 20μm. Images are representative of three independent experiments. f) GFP fluorescence quantified from IQ6011 (Phrg-1::GFP), IQ7771 (Pvha-6::HRG-7PR::mCherry; Phrg-1::GFP), and IQ7412 (Pvha-6::TM-HRG-7PR::mCherry; Phrg-1::GFP) fed dsRNA against vector, hrg-7300bp, and hrg-7ORF at 10 μM heme. GFP was quantified using COPAS BioSort. GFP is presented as fold change compared to vector. Graph represents the mean and SEM of three biological independent experiments. N=120 worms per treatment per experiment. ***P<0.001, **P<0.01, *P<0.05 (one-way ANOVA). See Supplementary Table 3 for statistics source data.
