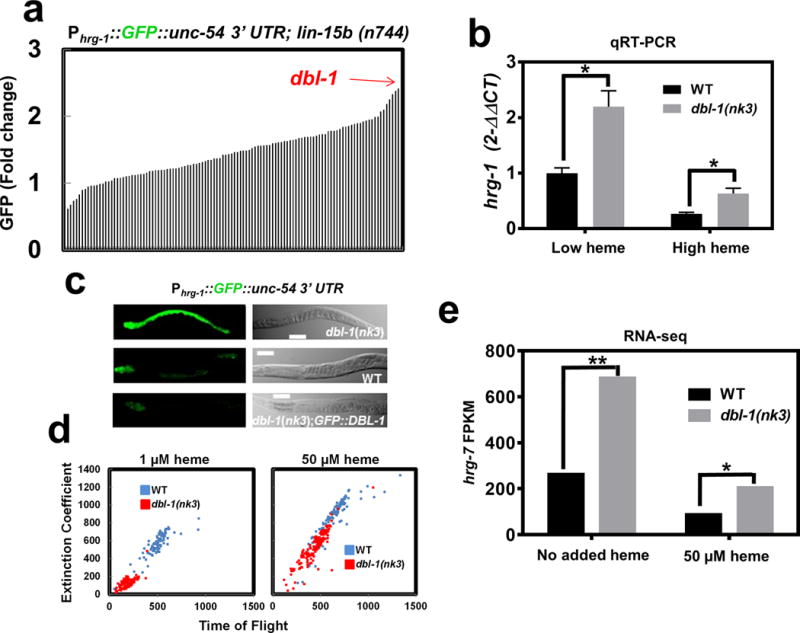
Figure 5. DBL-1/BMP regulates hrg-1 and hrg-7 through neuron-to-intestine signaling.

a) GFP quantification (mean of 120 worms) in strain IQ6015 [Phrg-1::GFP; lin-15b(n744)] fed dsRNA against 117 genes encoding secreted signaling factors. Y-axis is GFP fold change compared to worms fed control vector. GFP was quantified using COPAS BioSort. b) qRT-PCR of hrg-1 in dbl-1(nk3) mutant worms or WT broodmates fed OP50 (low heme) or OP50 with 50 μM heme (high heme). Graph represents the mean and SEM from five biological independent experiments. hrg-1 expression was normalized to gpd-2. Data is presented as fold change compared to hrg-1 expression in wildtype broodmates grown with low heme. ***P<0.001, **P<0.01, *P<0.05 (unpaired two-tailed t-test). See Supplementary Table 3 for statistics source data. c) Fluorescence images of IQ6011, IQ6311, and IQ6312 grown on OP50. Scale bar = 20 μm. Images are representative of three independent experiments. d) Size analyses (100-150) worms per treatment) quantified from IQ6011 and IQ6311 fed RP523 E. coli grown in l μM or 50 μM heme for 96 or 72 hours, respectively. Size was analyzed using COPAS BioSort. Graph is representative of a single experiment. Two experiments were repeated independently with similar results. e) FPKM values for hrg-7 from RNA-seq of dbl-1(nk3) mutants compared to WT broodmates. Graph represents the mean of FPKM values obtained from two biological independent experiments. ***P<0.001, **P<0.01, *P<0.05 (False Discovery Rate). See Supplementary Table 3 for statistics source data.
