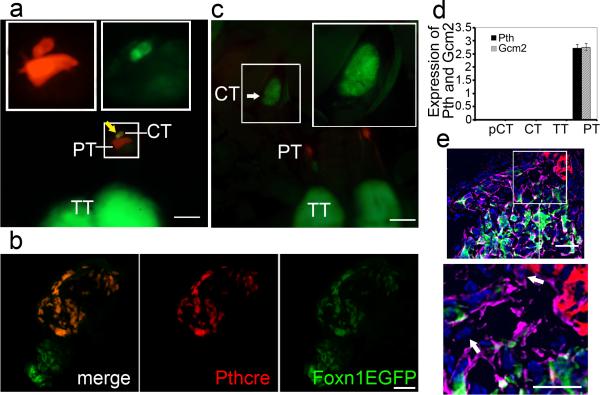
Figure 2. Parathyroid origin of a subset of cervical thymi.
(a, c) Whole mount images of 3 day old PthCre;CAG-td-Tomato;Foxn1::EGPF mice, parathyroid (PT) is red, thoracic thymus (TT) is green. Large boxes show high magnification of cervical thymi (CT) in small boxes. (Scale bar=200μm). (a) CT of parathyroid origin (yellow arrow) next to parathyroid. (b) Section of cervical thymi, one with green only, and one with green and red. (Scale bar=50μm). (c) Whole mount image of non-parathyroid origin CT (white arrow). (d) No expression of Pth and Gcm2 in cervical thymus regardless of origin. (N>3, Error bars represent SEM). (e) Epithelial (pankeratin-positive) cells at the thymus-parathyroid interface at E12.5 that express neither FOXN1 nor PTH (white arrow). Foxn1::EGPF, green; Pth-Cre activated CAG-td Tomato, red; pan-keratin, violet; DAPI, blue. (Scale bar=50μm).

