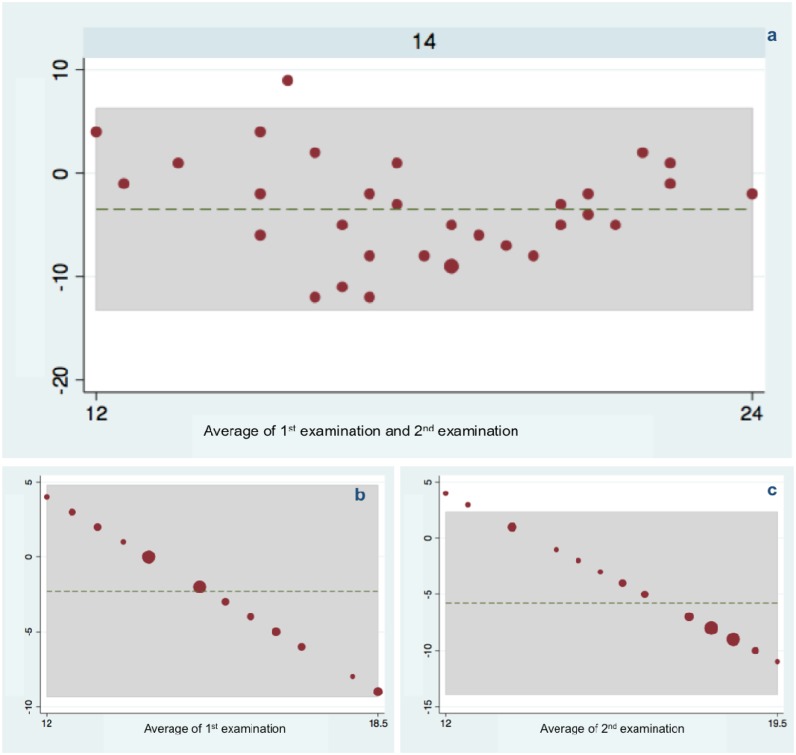
Figure 5.
Reliability in the evaluation of images captured using the transillumination device: intraexaminer reliability using a Bland–Altman plot of difference—each small dot is the average value of a single examiner observation, while larger dots are the sum of two or more examiners. The shaded region indicates 95% limits of agreement around the dashed line representing the mean.

