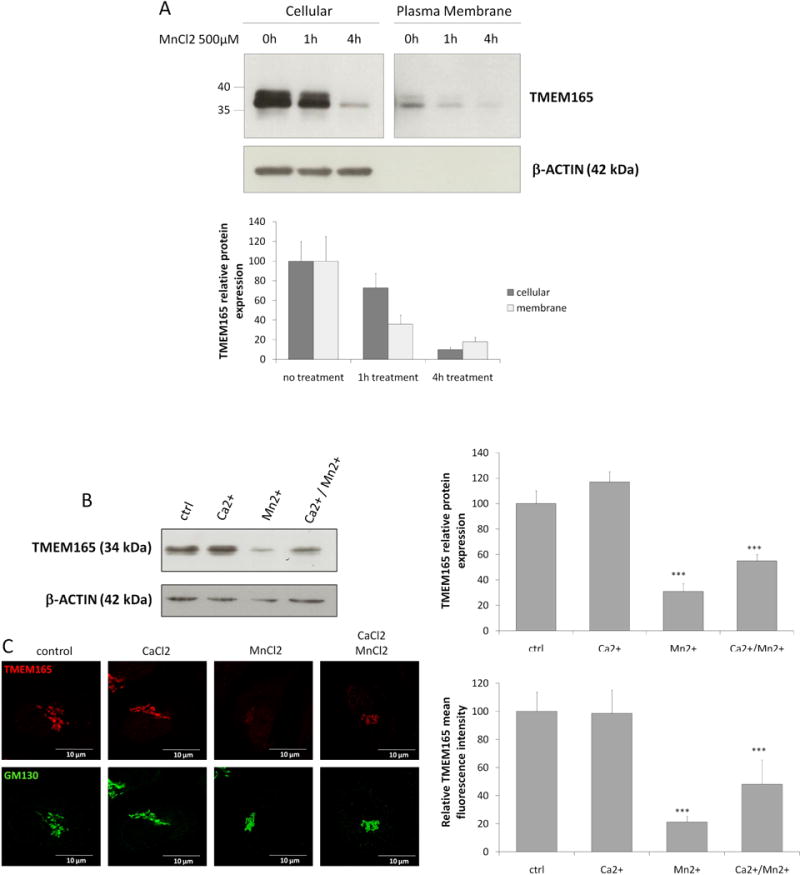
Figure 2. Plasma membrane TMEM165 is also degraded by Mn2+ and Ca2+ compete with Mn2+ for TMEM165 degradation.

(A) Cell surface biotinylation was performed in absence and presence of MnCl2 500 μM. Samples were prepared as described in materials and methods and subjected to SDS-PAGE and Western blot with the indicated antibodies. Lower panel shows the quantification of TMEM165 protein levels. The plasma membrane panel is separated from the cellular panel as we had to longer expose films to reveal the bands. (B) HEK293 cells were incubated with MnCl2 500 μM and/or CaCl2 2mM for 4h, then subjected to SDS-PAGE and Western blot with the indicated antibodies. Right panel shows the quantification of TMEM165 protein levels after normalization with actin (N = 2; *** = P value < 0,001). (C) HEK293 cells were incubated with MnCl2 500 μM and/or CaCl2 2mM for 4h then fixed and labeled with antibodies against TMEM165 and GM130 before confocal microscopy visualization (N = 2; *** = P value < 0,001). Right panel shows the quantification of the associated TMEM165 fluorescence intensity (N = 2; n = 50; *** = P value < 0,001).
