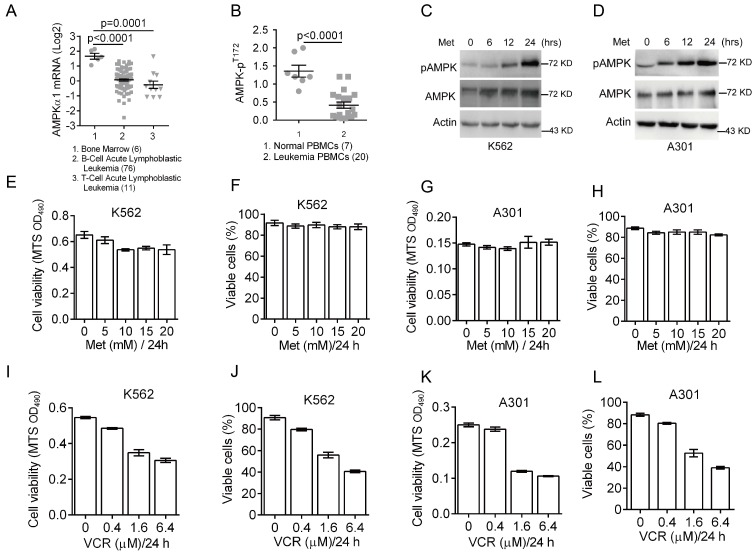
Figure 1.
Down-regulation of AMPK expression and activity in clinical leukemia samples and the effects of metformin or VCR on leukemia cell viability. (A) Oncomine analysis of Adersson leukemia data set is presented for AMPKα1 mRNA expression in clinical samples from patients with T-cell/B-cell acute lymphoblastic leukemia. (B) AMPK protein phosphorylation (pT172) in peripheral blood mononuclear cells (PBMC) from normal individuals or from leukemia patients were examined by Western blot analyses and quantified using Image Lab Analysis software. Actin protein levels in each sample were used as an internal control for normalization.(C-D) K562 or A301 cells were treated with 5 mM metformin for 0, 6, 12 or 24 hours. Western blot analyses were performed as indicated. (E-F) K562 cells were treated with metformin (0, 5, 10, 15, 20 or 25 mM) for 24 hours. Cell viability was assessed either by MTS assay (G) or by trypan blue exclusion assay (H). (G-H) A301 cells were treated with metformin (0, 5, 10, 15, 20 or 25 mM) for 24 hours. Cell viability was assessed either by MTS assay (G) or by trypan blue exclusion assay (H). (I-J) K562 cells were treated with VCR (0, 0.2, 0.4, 1.6 or 6.4 μM) for 24 hours. Cell viability was assessed either by MTS assay (G) or by trypan blue exclusion assay (H). (K-L) A301 cells were treated with VCR (0, 0.2, 0.4, 1.6 or 6.4 μM) for 24 hours. Cell viability was assessed either by MTS assay (G) or by trypan blue exclusion assay (H). The results are presented as the mean ± SEM from three independent experiments.

