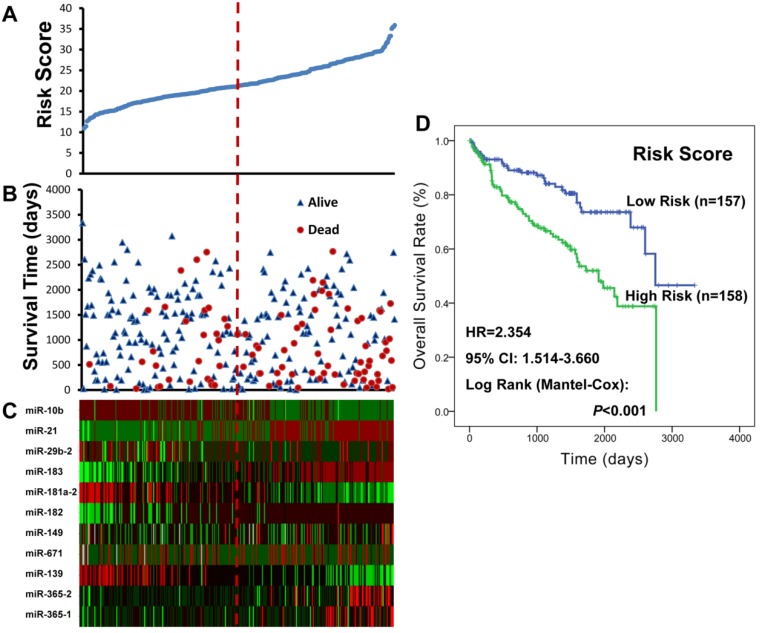
Figure 4.
The BAP1 mutation-specific miRNA risk score analysis of ccRCC patients with wild-type BAP1. A. miRNA risk score distribution; B. Patients' survival status and time; C. Heatmap of the miRNA expression profiles; rows represented miRNAs, and columns indicated patients. The red dotted line represented the miRNA signature cutoff value (median), which divided patients into low-risk and high-risk groups. D. Kaplan-Meier curve analysis of the miRNA signature for the overall survival in 315 ccRCC patients with wild-type BAP1.

