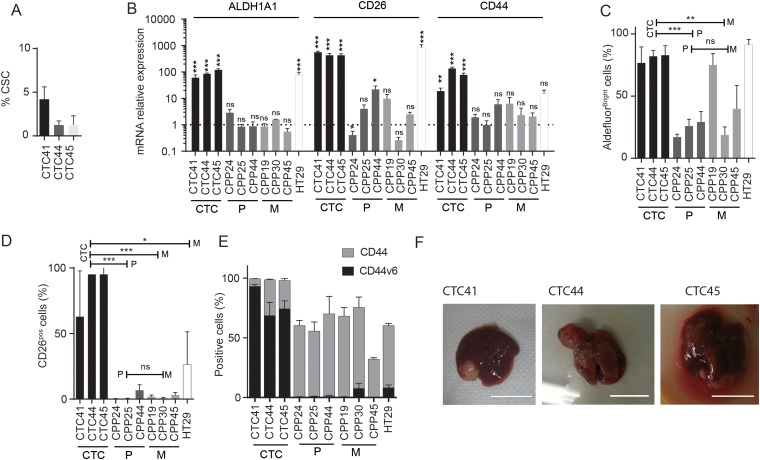
Figure 3.
(A). Cancer stem cell (CSC) frequency quantified in circulating tumour cell (CTC) lines after more than seven passages as tumour spheres using the extreme dilution assay (ELDA). Presence or absence of spheres is quantified as a binary outcome and stem cell frequency is calculated,19 and expressed as percentage of total cell number. (B) Expression of mRNAs encoding CSC markers such as ALDH1A1, CD26 and CD44, measured using reverse transcription-quantitative PCR analysis in CTC lines and cells derived from primary colon tumours (P) or liver metastases (M) of patients with CRC. Expression of mRNAs is expressed relative to the mean expression level across all primary and metastatic tumour-derived cell lines (which was set to 1). Results are expressed as mean±SEM, n>3, statistical analyses were performed using a Mann–Whitney U test. (C) Percentage of cells with high ALDH-activity in CTC lines, HT29 and tumour-derived cell lines, quantified using the Aldefluor assay kit (STEMCELL Technologies) and measured by flow cytometry. (D) Percentage of CD26-positive cells in CTC lines, HT29 and tumour-derived cell lines quantified by flow cytometry. (C and D) Results are expressed as mean±SEM, n>3, statistical analysis: Mann–Whitney U test comparing the mean value of each group of cells lines (CTC, P and M). (E) Percentage of CD44-positive (grey bars) and CD44 v6-positive (black bars) cells in CTC, HT29 and tumour-derived cell lines analysed by flow cytometry. (F) Photographs of liver metastases formed after intrasplenic injection of CTC lines in NOD/SCID mice (scale bar 1 cm).

