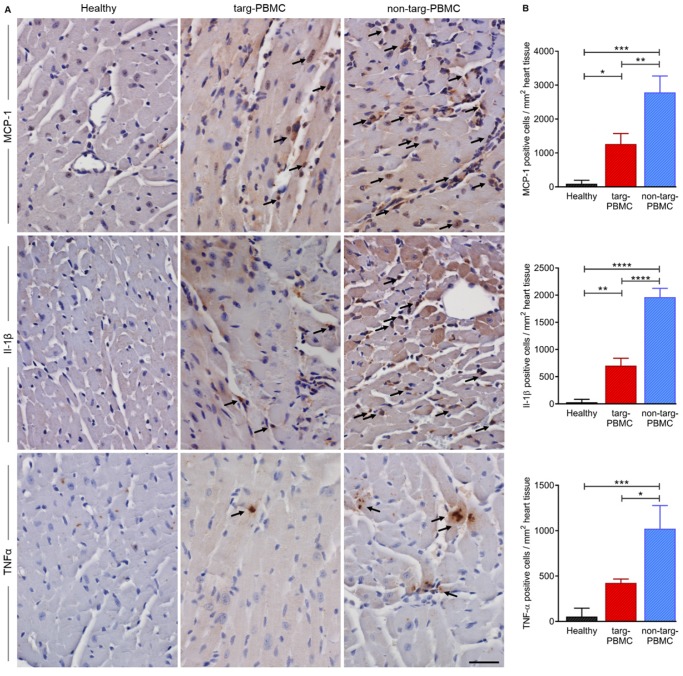
Figure 7.
Changes in cytokine levels in cardiac tissue 24 hours after IR injury. A) Cardiac section (n=3) were stained for MCP-1, Il-1β, and TNFα. Cytokine expression was reduced in the targ-PBMC treated mice compared to non-targ-PBMC mice. Arrows indicate cytokine expressing cells (scale bar: 30 μm, magnification: 400x). B) Bar graphs show quantitative analyses of cytokine positive cells per mg heart tissue within the infarct zone. Data are represented as mean ± SD, n=3.

