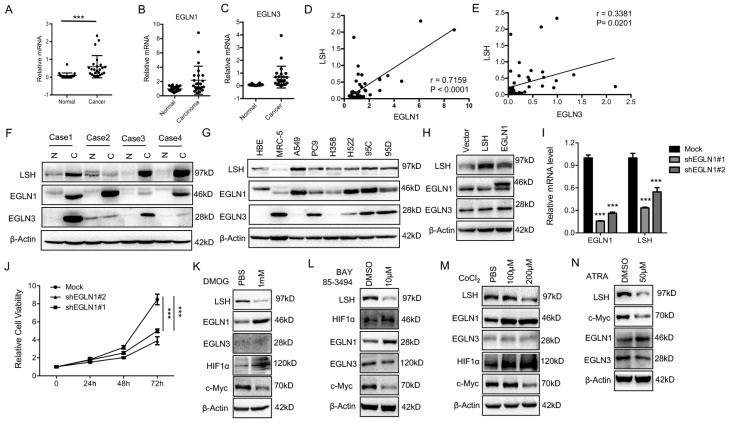
Figure 6.
The EGLN1/c-Myc axis activates LSH expression. (A-E) RT-qPCR analysis of LSH (A), EGLN1 (B) and EGLN3 (C) expression in 47 lung cancer samples paired with corresponding normal lung tissues. The correlations between LSH and EGLN1 (D), EGLN3 (E) were analyzed. (F) (F, G) Western blot analysis of LSH, EGLN1 and EGLN3 in lung cancer tissues and normal lung tissues (F) and a panel of lung cancer cells (G). (H) Western blot analysis of LSH, EGLN1 and EGLN3 in H358 cells overexpressing LSH or EGLN1. (I) Determination of LSH mRNA level by qRT-PCR after depletion of EGLN1 in A549 cells. (J) MTT assays to assess cell viability in A549 cells after depletion of EGLN1. (K-M) Western blot analysis of the indicated proteins after the treatment with DMOG (K), BAY 85-394 (L) and CoCL2 (M). (N) Western blot analysis of the indicated proteins after ATRA treatment. * P<0.05, ** P<0.01, *** P<0.001.

