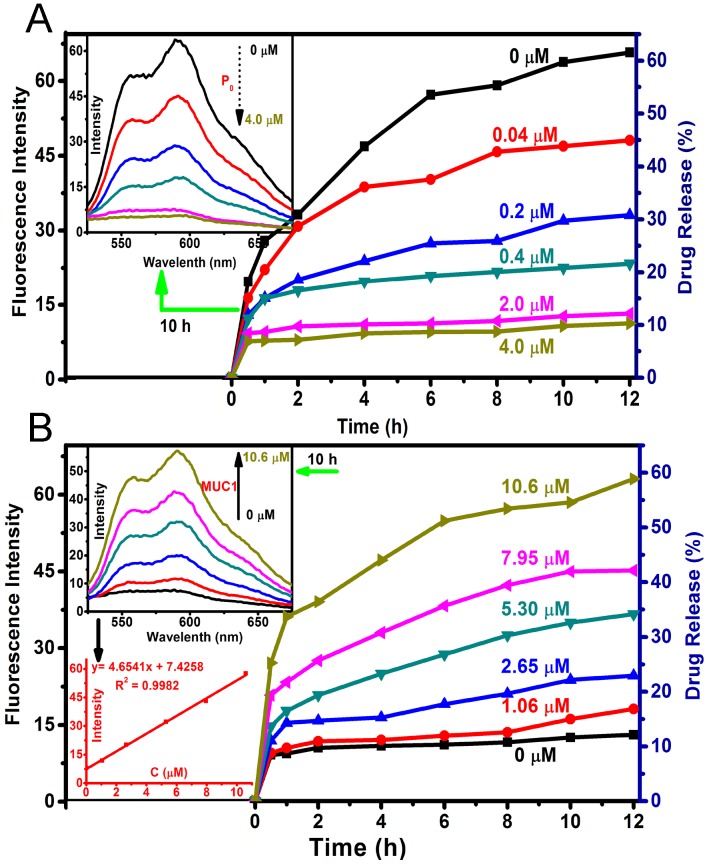
Fig 2.
(A) Drug release profiles of Dox-OMCN-P0 in PBS 5.0 with different concentrations of P0 cap. The inset was the fluorescent spectra at 10 h release. (B) Drug release profiles of Dox-OMCN-P0 in PBS 5.0 with different MUC1 concentrations. The insets were the fluorescent spectra and the linear curve between MUC1 concentrations and Dox fluorescence intensities after 10 h release.

