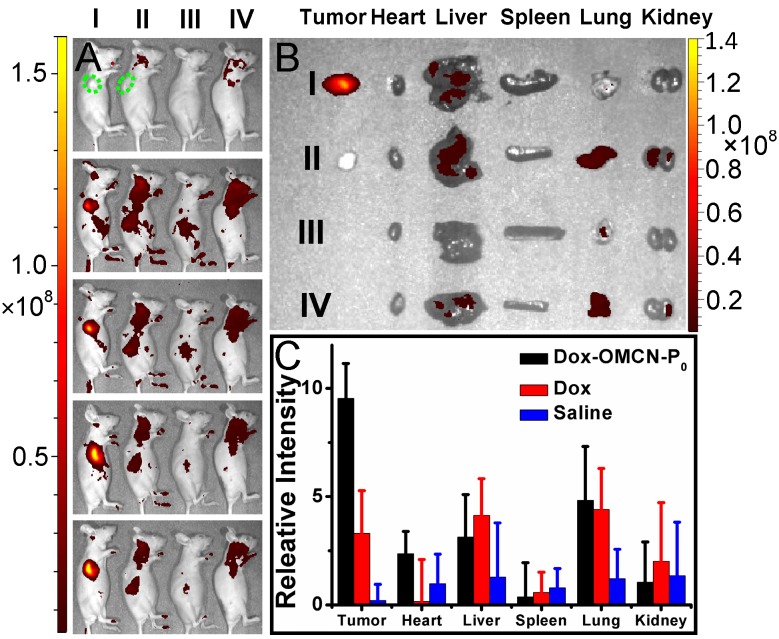
Fig 5.
(A) In vivo (0, 2, 4, 8 and 12 h, from top to bottom) and (B) ex vivo (12 h) fluorescent images of tumor-bearing (I, II) and normal (III, IV) nude mice treated with Dox-OMCN-P0 (I, III) and Dox (II, IV), respectively. Green dotted lines indicated the position of tumors. (C) Fluorescent analysis of tissue homogenate of tumor-bearing mice treated with Dox-OMCN-P0, Dox and saline for 8 h, respectively. Data are represented as mean ± SD (n = 3).

