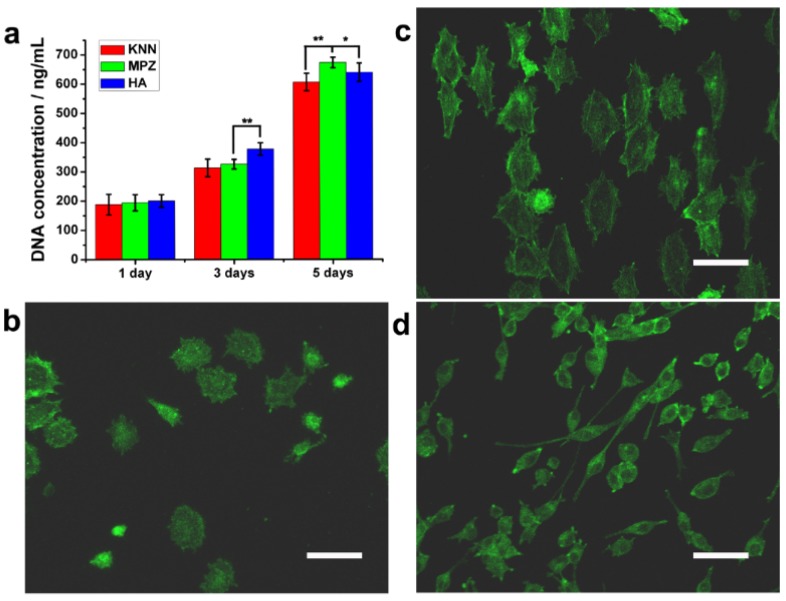
Figure 3.
Morphology, proliferation and differentiation of BMSCs on the MPZs and control surfaces. a) Quant-iT dsDNA Assay of BMSCs on the samples. The assay was repeated twice and expressed as means ± s.d.. Significant differences were determined using a one-way analysis of variance (ANOVA) followed by LSD-t test. (**) and (*) indicates a statisctic difference at p < 0.01 and p < 0.05, n=6. b-d) Fluorescence images of the actin skeletons of BMSCs on the MPZs surface and control samples after cultured for 3 days: b) polarized KNN, c) MPZs, d) HA. Scale bar: 75 μm. These images show that BMSCs on the MPZs are elongated and aligned along the MPZs substrate. The BMSCs on HA show a reduced adhesion area. F-actin was stained by FITC-labeled phalloidin (green).

