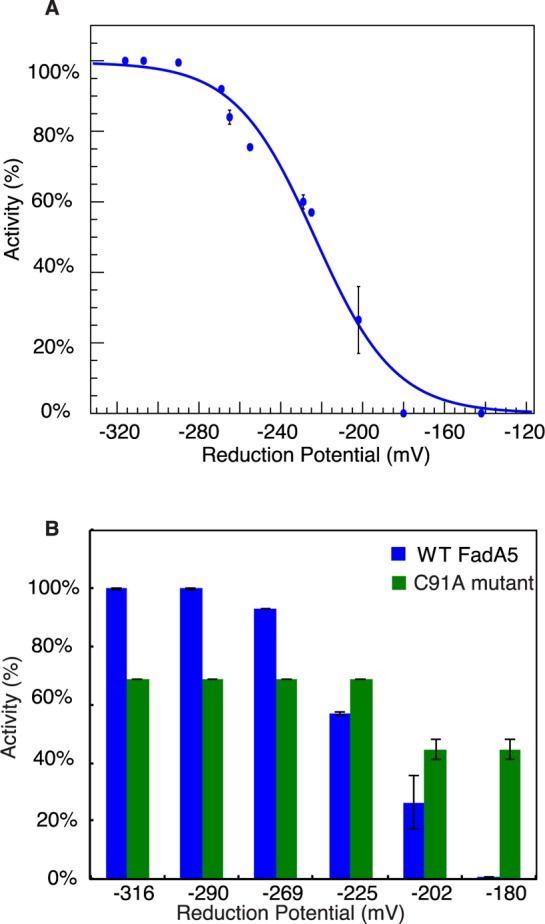
Figure 5.

Redox control of WT and C91A FadA5’s catalytic activity. (A) Percentage of reduced WT FadA5 as a function of its solution reduction potential at pH 7.0. The midpoint reduction potential is determined to be at −223 ± 3 mV. Error bars are standard error of measurement. (B) Relative catalytic activity of WT and C91A FadA5 at different solution reduction potentials, pH 7.0. Catalytic activities are normalized to WT FadA5 activity at −316 mV.
