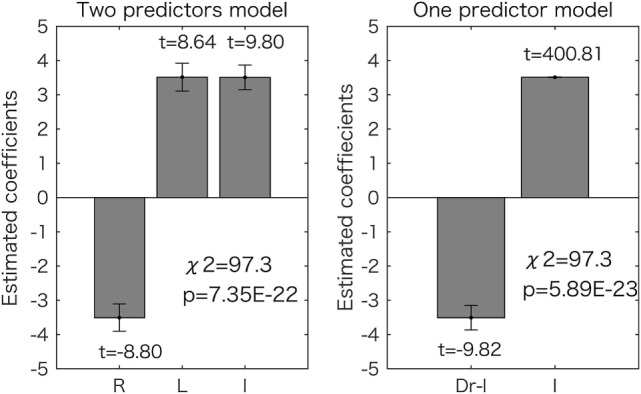
Figure 2.

Generalized linear model analyses for the overall (total) scores. Results for the two-predictor model (left side) and the one-predictor model (right side) are shown. The estimated coefficient values (±SE) are shown with t values (all the values are p < 0.05). The chi-square tests revealed that both models were significantly different from the constant model as shown in each graph. R, right 2D:4D; L, left 2D:4D; I, intercept.
