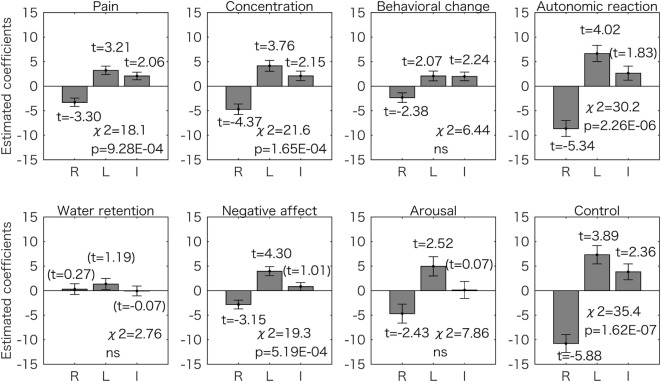
Figure 3.
Generalized linear model analyses using two predictors for the 8 symptom scores. Estimated coefficient values (±SE) are shown with t values. All the t values (except the values in the parentheses) are p < 0.05. The p values for the chi-square test are corrected for multiple comparisons using the Bonferroni method. For five symptom scores (pain, concentration, autonomic reaction, negative affect, and control), the right 2D:4D was negatively associated to symptom scores and the left 2D:4D was positively associated. ns, not significant (p > 0.05); R, right 2D:4D; L, left 2D:4D; I, intercept.

