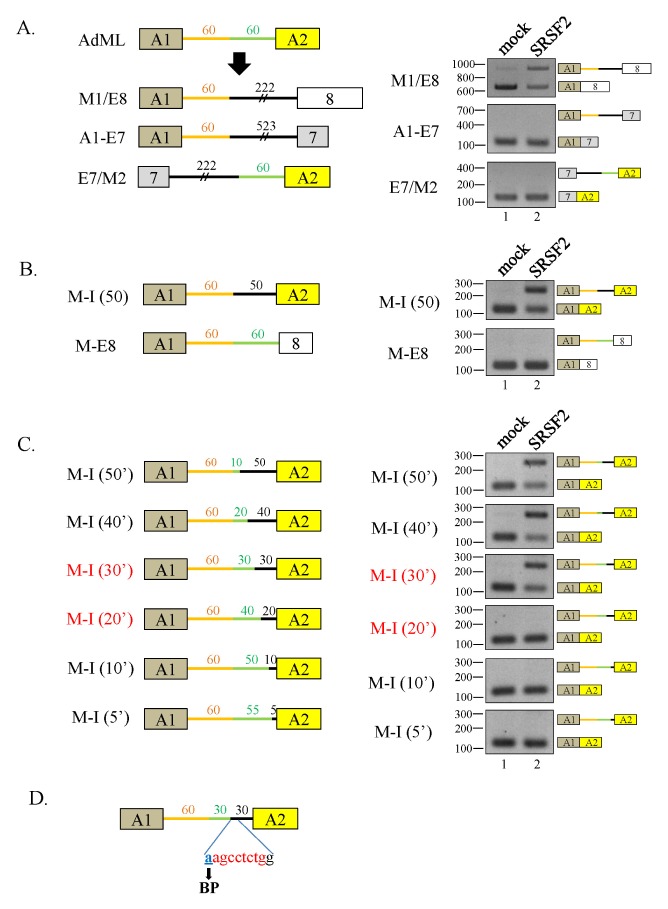
Fig. 3.
A 10 nt RNA sequence surrounding the BP of intron7 is required for splicing inhibition by SRSF2. (A) (Left panel) Schematic diagram of the M1/E8, A1–E7, and E7/M2 minigenes. (Right panel) RT-PCR analysis of intron splicing in the minigenes in SRSF2-expressing cells. (B) (Left panel) Schematic diagram of M-I (50) and M-E8 minigenes. (Right panel) RT-PCR analysis of the minigenes in SRSF2-expressing cells. (C) (Left panel) Schematic diagram of M-I (50′, 40′, 30′, 20′, 10′ and 5′) minigenes. Green lines represent intron sequences from AdML and black lines represent introns from SMN. The exon and intron lengths are also shown. (Right panel) RT-PCR analysis of intron splicing of the minigenes in the SRSF2-expressing cells. (D) The 10 nt regulatory sequence and its location within the AdML minigene are indicated.

