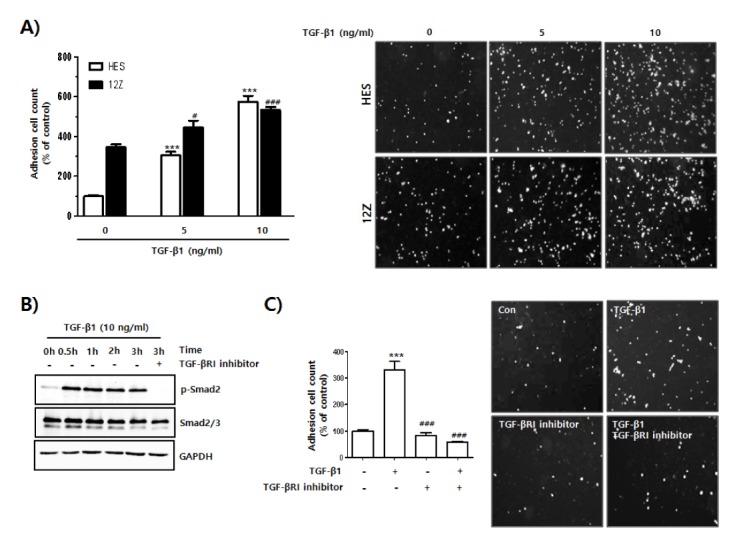
Fig. 2.

Increased adhesion of endometrial cells to mesothelial cells by activation of TGF-β1-mediated signaling. (A) HES and 12Z cells were seeded and cultured for 24 h. Medium was replaced and cells were incubated in serum free-medium with or without TGF-β1 for 24 h. Cells were labeled with CMFDA for 15 min at 37°C, then washed in 1 × PBS and gently transferred onto a Met-5A cell monolayer. After gentle shaking at 20 rpm for 20 min at 37°C, Cells were washed three times with 1 × PBS to remove unbound cells. Attached cells were visualized using a fluorescent microscope, and quantified using ImageJ software. The number of cells in 4 randomly chosen areas in each well was used for statistical analysis. The results from 3 independent experiments were calculated as a percentage of the control cell values and presented as mean ± SD. ***P < 0.001 compared to control white bar graph (1st column). #P < 0.05 and ###P < 0.001 compared to control black bar graph (1st column). Differences between mean values of experimental groups were determined using one-way analysis of variance (one-way ANOVA) with a Tukey’s post-hoc test, using GraphPad Prism software. (B) HES cells were seeded and cultured for 24 h. Medium was replaced and cells were incubated in serum free-medium with or without TGF-β1 in the presence or absence of TGF-βRI inhibitor for the indicated times. Phosphorylation levels of Smad2 were analyzed using western blot. GAPDH expression was used as an internal control. (C) HES cells were seeded and cultured for 24 h. Medium was replaced and cells were incubated in serum free-medium with or without TGF-β1 in the presence or absence of TGF-βRI inhibitor for the indicated times. Cells were labeled with CMFDA for 15 min at 37°C, then washed in 1 × PBS and then gently transferred onto a Met-5A cell monolayer. Number of cells bound to confluent Met-5A cells was manually counted. Four pictures were taken per well and the number of adherent cells was calculated as a percentage of the control cell values and shown as mean ± SD for three independent experiments. ***P < 0.001 compared to negative control (1st column). ###P < 0.001 compared to positive control (2nd column). Differences between mean values of experimental groups were determined using one-way ANOVA with a Tukey’s post-hoc test, using GraphPad Prism software.
