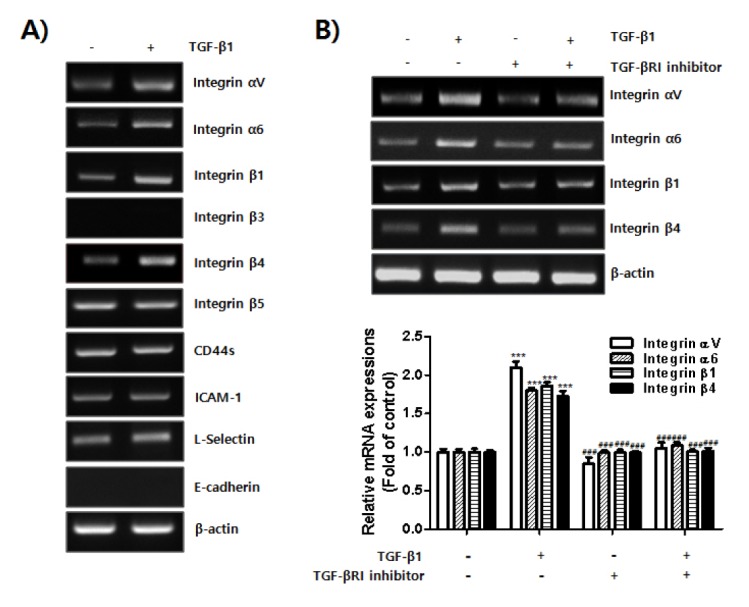
Fig. 3.

Expressions of integrin αV, α6, β1, and β4 induced by TGF-β1 in endometrial cells. HES cells were seeded and cultured for 24 h. Medium was replaced and cells were incubated in serum free-medium with or without TGF-β1 for 24 h. Total RNA was extracted from the cells. (A) mRNA expression of adhesion molecules was examined using RT-PCR. β-actin was used as an internal control. (B) HES cells were seeded and cultured for 24 h. Medium was replaced and the cells were incubated in serum free-medium with or without TGF-β1 in the presence or absence of TGF-βRI inhibitor for 24 h. Total RNA was extracted from the cells. Expression levels of integrin αV, α6, β1, and β4 were examined using RT-PCR. β-actin was used as an internal control. Band intensity of each integrin mRNA expression was quantified and normalized to β-actin internal control using densitometry. Data obtained from densitometric analyses are shown as bar graph. Data are expressed as fold of control and are shown as mean ± SD for three independent experiments ***P < 0.001 compared to each negative control (1st column). ###P < 0.001 compared to each positive control (2nd column). Differences between mean values of experimental groups were determined using a one-way ANOVA with a Tukey’s post-hoc test, using GraphPad Prism software.
