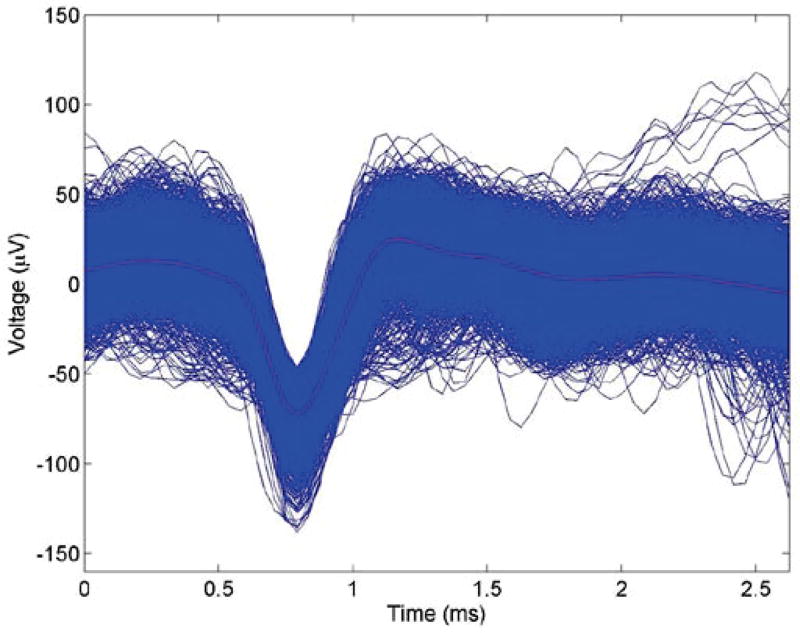
Fig. 10.
All the 2098 recorded spikes (blue) in Figure 9 were stacked together temporally. The calculated average spike (red) was also shown for comparison. The similar shape of the spikes indicates that the recorded spikes were originated from the same neuron.

